. 2010 Jan;20(1):45-58.
doi: 10.1101/gr.093302.109. Epub 2009 Oct 26.

Genome-wide mapping of alternative splicing in Arabidopsis thaliana

Affiliations

Genome-wide mapping of alternative splicing in Arabidopsis thaliana

Sergei A Filichkin et al. Genome Res. 2010 Jan.

Abstract

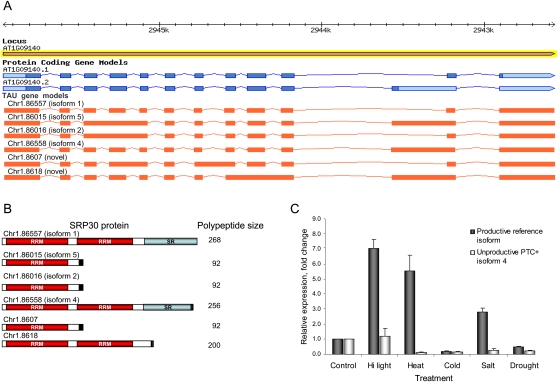
Alternative splicing can enhance transcriptome plasticity and proteome diversity. In plants, alternative splicing can be manifested at different developmental stages, and is frequently associated with specific tissue types or environmental conditions such as abiotic stress. We mapped the Arabidopsis transcriptome at single-base resolution using the Illumina platform for ultrahigh-throughput RNA sequencing (RNA-seq). Deep transcriptome sequencing confirmed a majority of annotated introns and identified thousands of novel alternatively spliced mRNA isoforms. Our analysis suggests that at least approximately 42% of intron-containing genes in Arabidopsis are alternatively spliced; this is significantly higher than previous estimates based on cDNA/expressed sequence tag sequencing. Random validation confirmed that novel splice isoforms empirically predicted by RNA-seq can be detected in vivo. Novel introns detected by RNA-seq were substantially enriched in nonconsensus terminal dinucleotide splice signals. Alternative isoforms with premature termination codons (PTCs) comprised the majority of alternatively spliced transcripts. Using an example of an essential circadian clock gene, we show that intron retention can generate relatively abundant PTC(+) isoforms and that this specific event is highly conserved among diverse plant species. Alternatively spliced PTC(+) isoforms can be potentially targeted for degradation by the nonsense mediated mRNA decay (NMD) surveillance machinery or regulate the level of functional transcripts by the mechanism of regulated unproductive splicing and translation (RUST). We demonstrate that the relative ratios of the PTC(+) and reference isoforms for several key regulatory genes can be considerably shifted under abiotic stress treatments. Taken together, our results suggest that like in animals, NMD and RUST may be widespread in plants and may play important roles in regulating gene expression.


Figures

Figure 1.
Figure 1.
Flow of experiments and data analysis. (A) Design of Arabidopsis RNA-seq experiments and methods of preparation of cDNA libraries for HTS. FL, full length enriched oligo(dT) primed cDNA libraries; RP, randomly primed cDNA libraries. (B) Computational pipeline for HTS data analyses.
Figure 2.
Figure 2.
Transcription profile of the A. thaliana genome. Distribution of RNA-seq microread density along chromosome length is shown. Each vertical blue bar represents log2 of the frequency of unique single-copy cDNA-derived microreads plotted against chromosome coordinates. A schematic drawing of the chromosome and its features is shown below the microread density. Approximate boundaries of Arabidopsis centromeres (Kotani et al. 1999; The Arabidopsis Genome Initiative 2000; Tabata et al. 2000; Kumekawa et al. 2001; Copenhaver 2003) are depicted in gray. Red circles indicate unsequenced centromeric gaps. Heterochromatic knobs are denoted by violet ellipses. Chromosome portions corresponding to the telomeres and nucleolar organizing regions are not shown.
Figure 3.
Figure 3.
Depth and coverage of annotated gene features. (A) Distribution of the RNA-seq microreads along annotated Arabidopsis annotated genomic features. Among reads perfectly matching the Arabidopsis genome, there were 71.3 million matches to annotated exons, 6.7 million matches to annotated splice junctions, 4.4 million matches to annotated intergenic regions, and 1.4 million matches to annotated introns. Of the remaining 187 million reads, ∼20% matched the Arabidopsis genome allowing for up to two mismatches and the remaining ∼50% aligned with more than two mismatches or did not match at all. (B) Box-and-whisker plots of log2-transformed numbers of microread matches at each nucleotide position for TAIR annotated intergenic regions (IGR), 5′ untranslated regions (5′UTR), 3′ untranslated regions (3′UTR), introns (Int), exons (Ex), genes (Gene), cDNAs (cDNA), coding sequences (CDS), and splice junctions (SJs). The bottom and top of the box represent the 25th and 75th quartiles, respectively, and the middle line is the median. Black filled circles show outliers. (C) Distribution of the RNA-seq microread coverage along the length of the transcriptional unit. The median depth of coverage along the length of each individual cDNA was calculated as described in the Supplemental Material and plotted against the relative length of the transcriptional unit (cDNA) for full-length enriched oligo(dT)-primed libraries (blue diamonds) and randomly primed libraries (yellow circles). The combined data from the two libraries are depicted by red triangles. (D) Coverage over the length of TAIR8 annotated cDNAs. Perfect match 32-mer Illumina reads were mapped to the TAIR8 annotated cDNAs for nuclear genes using HashMatch (http://mocklerlab-tools.cgrb.oregonstate.edu/). Illumina read coverage along the predicted sequence features was calculated using a Perl script. Box-and-whisker plots depict the Illumina coverage calculated as the percentage of bases along the length of the cDNA sequence that was supported by Illumina reads from the FL, RP, and combined FL + RP data sets. The bottom and top of the box represent the 25th and 75th quartiles, respectively. The black line is the median and the red diamonds are the mean.
Figure 4.
Figure 4.
Survey of constitutive and alternative splicing in Arabidopsis. (A) Detection of annotated gene features and alternative splicing events by RNAseq. Annotated gene features (Exon, SJ) and alternative splicing events, including alternative splicing at both acceptor and donor splice sites (AltEx), an alternative splice junction (AltSJ) and alternative intronic sequences (AltInt) were identified by aligning RNA-seq microreads as described in the Supplemental material. Pie charts depict the proportions of the annotated features in full-length (FL), randomly primed (RP), and combined (FL + RP) cDNA libraries detected by at least one perfect match RNA-seq read. Total (%) indicates the total number and percentage of annotated features detected in the combined (FL + RP) data. (B) Distribution of novel splicing events among annotated genes. The histogram depicts the numbers of novel alternative splicing events and alternatively spliced genes containing consensus GT-AG and other nonconsensus intron splice signal dinucleotides and introns retention events within TAIR8-annotated genes. (C) Pie charts depict the proportions of consensus and nonconsensus intron terminal dinucleotide classes among annotated TAIR8 introns (TAIR8; upper panel) and the combined TAIR8 + supersplat-predicted introns (TAIR + SS; lower panel). (D) The histogram depicts the relative representation of consensus and nonconsensus splice junctions as a frequency distribution. The relative representation was calculated (the average number of reads spanning nonconsensus splice junctions/the average number of reads spanning constitutive consensus splice junctions in the same gene) for 1539 genes that contain both consensus and nonconsensus introns.
Figure 5.
Figure 5.
Identification of stress-associated alternative splicing. (A) Exons, introns, and splice junctions were identified by the changes in expression levels (i.e., by the normalized number of the RNA-seq microreads encompassing each feature) under different abiotic stress conditions relative to untreated control. The “Exons” panel represents 807 differentially expressed exons; change in expression level ranged from −30- to +82-fold normalized to untreated control. The “Introns” panel represents 1230 differentially expressed introns with expression changes ranging from −54- to +263-fold. The “Splice Junctions” panel features 1093 exon–exon splice junctions (with changes in normalized expression from −22- to +46-fold). Gene clusters were computed by the default settings of heatmap.2 in the R “gplots” package as described in the Methods. Up- and down-regulated features are shown in red and green, respectively; black corresponds to no change relative to the untreated control. (B) Cold-induced intron retention (bracketed) in the OUTER ENVELOPE PROTEIN 16 (AT2G28900) transcript. Changes in microread density coverage are indicated by a horizontal bracket. (C) Stress-regulated exon skipping (brackets) and cassette exon (arrow) events in the ACCLIMATION OF PHOTOTSYNTHESIS TO ENVIRONMENT 2 (AT5G46110) transcript. (D) Detection and validation of novel SJs in transcripts of splicing factor SRP34 (AT1G02840). SJs corresponding to the untreated control, high light, heat, and dehydration treatments are shown in gray, yellow, red, and brown, respectively. Position of alternatively spliced intron 10 is bracketed. A previously undetected splice isoform containing a poison cassette exon (red rectangle) is illustrated in the bottom panel. Locations of reference and premature termination codons are indicated by red (top) and black (bottom) stars, respectively.
Figure 6.
Figure 6.
Intron retention and novel splice junction events in the CCA1 locus. (A) Empirical CCA1 gene models (orange) generated by the TAU tool using RNA-seq data. (B) Predicted polypeptides are shown schematically with the DNA binding MYB domain shown by a red box. (C) Gene models of homologous CCA1/LHY loci in A. thaliana, Oryza sativa, Brachypodium distachyon, and Populus trichocarpa. cDNA microread coverage is shown for Arabidopsis and Brachypodium. SJs of intron 4 and 4a splicing in Arabidopsis and Brachypodium are marked by brown broken lines. (D) Quantification of the IntronR4 event by qRT-PCR under different abiotic stress conditions. Lanes labeled Hi Light, Heat, Cold, Salt, and Drought correspond to high light, heat, cold, salt, and dehydration treatments, respectively. Relative expression was estimated using −ΔΔCt method (Livak and Schmittgen 2001) and EF-1-ALPHA mRNA as an internal housekeeping gene control. (E) RT-PCR confirmation of CCA1 IntronR4 in rice, poplar, and Brachypodium. IntronR4-specific primers were designed as described for A. thaliana (as shown in panel B). RT-PCR products corresponding to the retained intron 4 (if downstream intron 5 is spliced) are denoted by an asterisk (*); pre-mRNAs are indicated by a dash (–). Sanger sequencing of gel-purified amplified DNA fragments confirmed the sequence of all RT-PCR products. The predicted fragment sizes are 492, 573, and 782 bp for rice (Os, Oryza sativa, ssp. Japonica, locus ID: LOC_Os08g06110), Brachypodium (Bd, Brachypodium distachyon, locus ID: Bradi3g16510), and poplar (Pt, Populus trichocarpa, locus ID: estExt_Genewise1_v1.C_LG_XIV1950), respectively.
Figure 7.
Figure 7.
Stress-regulated alternative splicing of Arabidopsis splicing modulator ATSRP30. (A) Known isoforms (blue) and TAU-predicted variants (orange) of the ATSRP30 gene. (B) Predicted ATSRP30 protein domain structures (RRM, RNA recognition motif; SR, serine/arginine rich domain) and polypeptide sizes. (C) Quantification of accumulation of full-length ATSRP30 (reference isoform 1) and a PTC-containing isoform (4) by qRT-PCR under various abiotic stresses. Note the significant shift in the relative isoform ratio under high light, heat, and salt treatments. Relative expression levels were calculated using −ΔΔCt method (Livak and Schmittgen 2001) and EF-1-ALPHA mRNA as an internal reference control.

References

    1. Alexandrov NN, Troukhan ME, Brover VV, Tatarinova T, Flavell RB, Feldmann KA. Features of Arabidopsis genes and genome discovered using full-length cDNAs. Plant Mol Biol. 2006;60:69–85. - PubMed
    1. Ali GS, Reddy ASN. ATP, phosphorylation and transcription regulate the mobility of plant splicing factors. J Cell Sci. 2006;119:3527–3538. - PubMed
    1. Ali GS, Palusa SG, Golovkin M, Prasad J, Manley JL, Reddy AS. Regulation of plant developmental processes by a novel splicing factor. PLoS One. 2007;2:e471. doi: 10.1371/journal.pone.0000471. - DOI - PMC - PubMed
    1. Alioto TS. U12DB: A database of orthologous U12-type spliceosomal introns. Nucleic Acids Res. 2006;35:D110–D115. - PMC - PubMed
    1. The Arabidopsis Genome Initiative. Analysis of the genome sequence of the flowering plant Arabidopsis thaliana. Nature. 2000;408:796–815. - PubMed

Publication types