

Interlaboratory study characterizing a yeast performance standard for benchmarking LC-MS platform performance
- PMID: 19858499
- PMCID: PMC2830837
- DOI: 10.1074/mcp.M900222-MCP200
Interlaboratory study characterizing a yeast performance standard for benchmarking LC-MS platform performance
Abstract
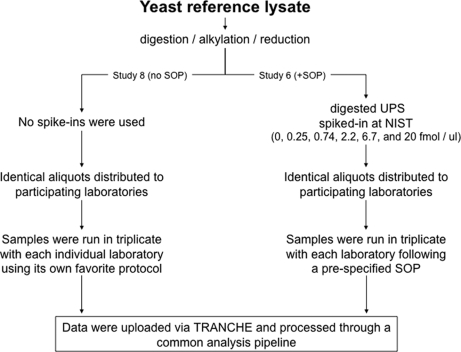
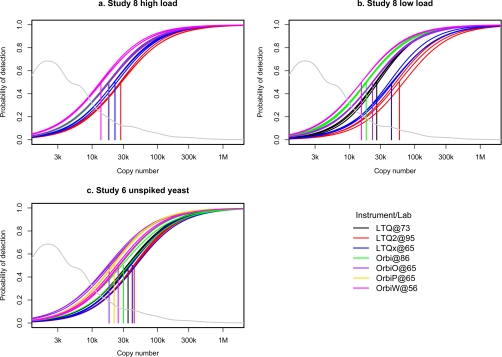
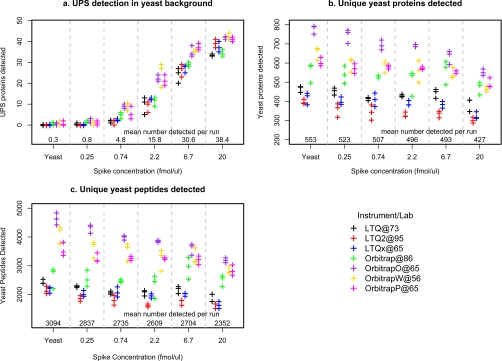
Optimal performance of LC-MS/MS platforms is critical to generating high quality proteomics data. Although individual laboratories have developed quality control samples, there is no widely available performance standard of biological complexity (and associated reference data sets) for benchmarking of platform performance for analysis of complex biological proteomes across different laboratories in the community. Individual preparations of the yeast Saccharomyces cerevisiae proteome have been used extensively by laboratories in the proteomics community to characterize LC-MS platform performance. The yeast proteome is uniquely attractive as a performance standard because it is the most extensively characterized complex biological proteome and the only one associated with several large scale studies estimating the abundance of all detectable proteins. In this study, we describe a standard operating protocol for large scale production of the yeast performance standard and offer aliquots to the community through the National Institute of Standards and Technology where the yeast proteome is under development as a certified reference material to meet the long term needs of the community. Using a series of metrics that characterize LC-MS performance, we provide a reference data set demonstrating typical performance of commonly used ion trap instrument platforms in expert laboratories; the results provide a basis for laboratories to benchmark their own performance, to improve upon current methods, and to evaluate new technologies. Additionally, we demonstrate how the yeast reference, spiked with human proteins, can be used to benchmark the power of proteomics platforms for detection of differentially expressed proteins at different levels of concentration in a complex matrix, thereby providing a metric to evaluate and minimize pre-analytical and analytical variation in comparative proteomics experiments.
Figures
References
-
- Klimek J., Eddes J. S., Hohmann L., Jackson J., Peterson A., Letarte S., Gafken P. R., Katz J. E., Mallick P., Lee H., Schmidt A., Ossola R., Eng J. K., Aebersold R., Martin D. B. ( 2008) The standard protein mix database: a diverse data set to assist in the production of improved Peptide and protein identification software tools. J. Proteome Res 7, 96– 103 - PMC - PubMed
-
- Barker P. E., Wagner P. D., Stein S. E., Bunk D. M., Srivastava S., Omenn G. S. ( 2006) Standards for plasma and serum proteomics in early cancer detection: a needs assessment report from the national institute of standards and technology—National Cancer Institute Standards, Methods, Assays, Reagents and Technologies Workshop, August 18–19, 2005. Clin. Chem 52, 1669– 1674 - PubMed
-
- Vitzthum F., Siest G., Bunk D. M., Preckel T., Wenz C., Hoerth P., Schulz-Knappe P., Tammen H., Adamkiewicz J., Merlini G., Anderson N. L. ( 2007) Metrological sharp shooting for plasma proteins and peptides: the need for reference materials for accurate measurements in clinical proteomics and in vitro diagnostics to generate reliable results. Proteomics Clin. Appl 1, 1016– 1035 - PubMed
-
- Shevchenko A., Jensen O. N., Podtelejnikov A. V., Sagliocco F., Wilm M., Vorm O., Mortensen P., Shevchenko A., Boucherie H., Mann M. ( 1996) Linking genome and proteome by mass spectrometry: large-scale identification of yeast proteins from two dimensional gels. Proc. Natl. Acad. Sci. U.S.A 93, 14440– 14445 - PMC - PubMed
Publication types
MeSH terms
Substances
Grants and funding
LinkOut - more resources
Full Text Sources
Medical
Molecular Biology Databases
