. 2009 Dec;62(6):1510-22.
doi: 10.1002/mrm.22135.

Magnetic susceptibility mapping of brain tissue in vivo using MRI phase data

Affiliations

Magnetic susceptibility mapping of brain tissue in vivo using MRI phase data

Karin Shmueli et al. Magn Reson Med. 2009 Dec.

Abstract

Phase images in susceptibility-weighted MRI of brain provide excellent contrast. However, the phase is affected by tissue geometry and orientation relative to the main magnetic field (B(0)), and phase changes extend beyond areas of altered susceptibility. Magnetic susceptibility, on the other hand, is an intrinsic tissue property, closely reflecting tissue composition. Therefore, recently developed inverse Fourier-based methods were applied to calculate susceptibility maps from high-resolution phase images acquired at a single orientation at 7 T in the human brain (in vivo and fixed) and at 11.7 T in fixed marmoset brain. In susceptibility images, the contrast of cortical layers was more consistent than in phase images and was independent of the structures' orientation relative to B(0). The contrast of iron-rich deep-brain structures (red nucleus and substantia nigra) in susceptibility images agreed more closely with iron-dominated R(2) (*) images than the phase image contrast, which extended outside the structures. The mean susceptibility in these regions was significantly correlated with their estimated iron content. Susceptibility maps calculated using this method overcome the orientation-dependence and non-locality of phase image contrast and seem to reflect underlying tissue composition. Susceptibility images should be easier to interpret than phase images and could improve our understanding of the sources of susceptibility contrast.


Figures

Figure 1
Figure 1
Simulations showing calculated susceptibility distributions for a cylinder (χ=0.02 ppm) perpendicular to B0 at different truncation values (t) applied to F (Eqs. [2–3]). The top row of images shows calculations with no added phase noise and the bottom row shows calculations with added phase noise σ = 0.1 rad. All images are scaled between ± 0.02 ppm. The graphs show (A) the variation of the mean calculated susceptibility inside the cylinder (χ=0.02 ppm, dashed line) with t, (B) the variation of the standard deviation of the calculated susceptibility outside the cylinder as a function of t and (C) the change in the normalized mean square error between the calculated and true susceptibility distributions with t. All the graphs are plotted for the following three phase noise values: 0 (Δ), 0.05 (+) and 0.1 (×) rad. The mean susceptibility (A) is independent of the noise value.
Figure 2
Figure 2
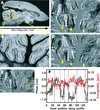
High resolution images of a fixed marmoset brain. Image A shows a sagittal slice from the magnitude image volume with the box highlighting the cerebellar region expanded in B, C and D. B is the magnitude image, C is the phase image (scaled between ± 10 Hz) and D is the calculated tissue susceptibility map (scaled between ± 40 × 10−9). The arrows and the orange profile (E) show the Purkinje cell layer. The phase (black, from C) and susceptibility (red, from D) values along the profile (E) are plotted (F) with voxel zero at the arrowhead. In F, the left-hand phase axis is scaled such that any phase is equivalent to the phase that would arise inside a cylinder, parallel to B0, with susceptibility equal to that shown on the right-hand axis. The vertical lines in F show the points at which the profile changed direction with respect to B0.
Figure 3
Figure 3
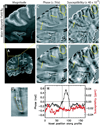
Susceptibility maps of a human brain tissue section. The magnitude image is shown in A and zoomed box B. The phase images of the boxed region (C and E) are scaled between ± 7 Hz and the corresponding susceptibility images (D and F) are scaled between ± 40 × 10−9. The arrows highlight a cortical layer running parallel (arrow 1) and perpendicular (arrow 2) to B0. Ellipse 3 contains several vessels (or other small regions of altered susceptibility). Phase images C and E are the result of different methods of spatial high-pass filtering: homodyne filtering (using a 2-D Gaussian of FWHM = 26 voxels) (C) or subtraction of a fifth order polynomial fit (E). Images D and F are the results of susceptibility calculations from images C and E respectively. The cortical layer profile (in orange in G) was drawn on a zoomed region of C. The phase (black, from C) and susceptibility (red, from D) values along the profile (G) are plotted (H) with voxel zero at the arrowhead. In H, the left-hand phase axis is scaled such that any phase is equivalent to the phase that would arise inside a cylinder, parallel to B0, with susceptibility equal to that shown on the right-hand axis. The vertical lines in H show the points at which the profile changed direction with respect to B0.
Figure 4
Figure 4
The effect of truncation value on susceptibility maps. Susceptibility maps of a single slice of fixed human brain tissue shown in Figure 3. The calculations were carried out with different t values for F in Eq. [2], i.e. 1 (A), 5 (B), 10 (C) and 20 (D). All the images are scaled between ± 0.04 ppm (40 × 10−9). A graph of the standard deviation of the susceptibility in the background region shown by the orange box in (B) against t is shown in E.
Figure 5
Figure 5
Susceptibility maps in an occipital region of the human brain in vivo. One full coronal slice of the magnitude image is shown (A) with a box outlining the region in which the susceptibility was calculated. The boxed region is zoomed and its magnitude (B) residual phase (± 5Hz) (C) and calculated susceptibility (± 50 × 10−9) (D) are shown. The dashed tracings outline a band near the border between the gray and white matter which is highlighted by the profile (in orange in E) on a zoomed region of C. The phase (black, from C) and susceptibility (red, from D) values along the profile (E) are plotted (F) with voxel zero at the arrowhead. In F, the left-hand phase axis is scaled such that any phase is equivalent to the phase that would arise inside a cylinder, parallel to B0, with susceptibility equal to that shown on the right-hand axis. The vertical lines in F show the points at which the profile changed direction with respect to B0.
Figure 6
Figure 6
Susceptibility maps of iron-rich structures in vivo. A single slice of the coronal multi-echo images of the brain of a healthy volunteer is shown. The top row shows the whole image (masked to exclude non-brain tissues) and the bottom row shows zoomed images of the boxed region. The iron-rich deep-brain structures: the red nucleus (1) and substantia nigra (2), are clearly visible in the magnitude images acquired at the longest echo time (A), and in the R2* maps (0–80 Hz) (B). The field maps (±10 Hz, reversed to appear similar to phase images) are shown in C and the susceptibility maps (± 80 × 10−9) are shown in D.
Figure 7
Figure 7
The relationship between brain tissue susceptibility and iron content: the results of a region-of-interest (ROI) analysis are shown. The ROIs are shown overlaid on one slice of the R2* map (A). The red nuclei are shown in pink, the left and right putamen are shown in yellow and the left and right substantia nigra are shown in light blue. The graphs show the mean (and standard error of this mean as error bars) of the ROI values in the field (B), R2* (C) and susceptibility maps (D) plotted against the literature-based estimate (26) of the iron content of each region. The correlation coefficients (r) are shown for each graph.

References

    1. Fischl B, Wald LL. Phase maps reveal cortical architecture. Proc Natl Acad Sci U S A. 2007;104(28):11513–11514. - PMC - PubMed
    1. Duyn JH, van Gelderen P, Li TQ, de Zwart JA, Koretsky AP, Fukunaga M. High-field MRI of brain cortical substructure based on signal phase. Proc Natl Acad Sci U S A. 2007;104(28):11796–11801. - PMC - PubMed
    1. Bourekas EC, Christoforidis GA, Abduljalil AM, Kangarlu A, Chakeres DW, Spigos DG, Robitaille PM. High resolution MRI of the deep gray nuclei at 8 Tesla. J Comput Assist Tomogr. 1999;23(6):867–874. - PubMed
    1. Ogg RJ, Langston JW, Haacke EM, Steen RG, Taylor JS. The correlation between phase shifts in gradient-echo MR images and regional brain iron concentration. Magn Reson Imaging. 1999;17(8):1141–1148. - PubMed
    1. Yao B, Li TQ, Gelderen P, Shmueli K, de Zwart JA, Duyn JH. Susceptibility contrast in high field MRI of human brain as a function of tissue iron content. Neuroimage. 2009;44(4):1259–1266. - PMC - PubMed

Publication types