. 2009 Dec;62(6):1431-9.
doi: 10.1002/mrm.22113.

Three-dimensional micro-MRI analysis of cerebral artery development in mouse embryos

Affiliations

Three-dimensional micro-MRI analysis of cerebral artery development in mouse embryos

Cesar A Berrios-Otero et al. Magn Reson Med. 2009 Dec.

Abstract

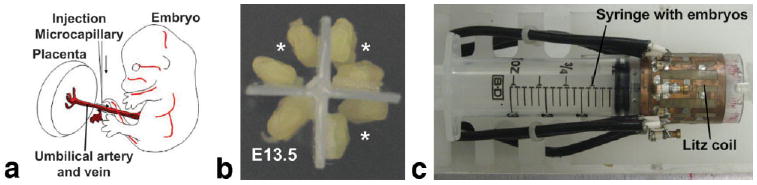
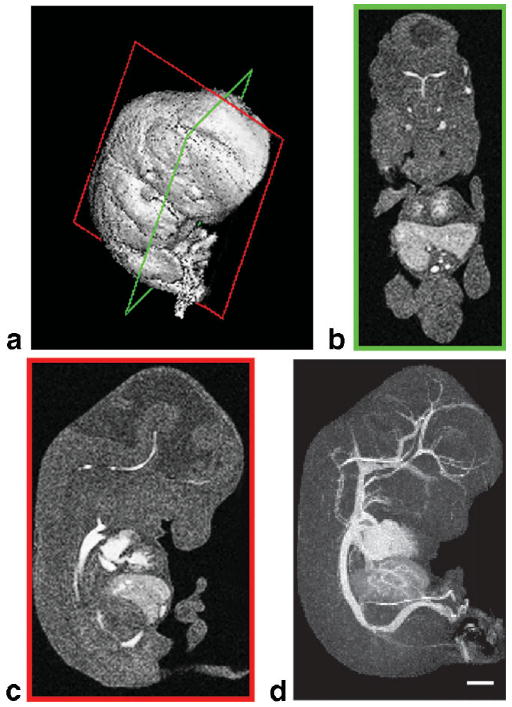
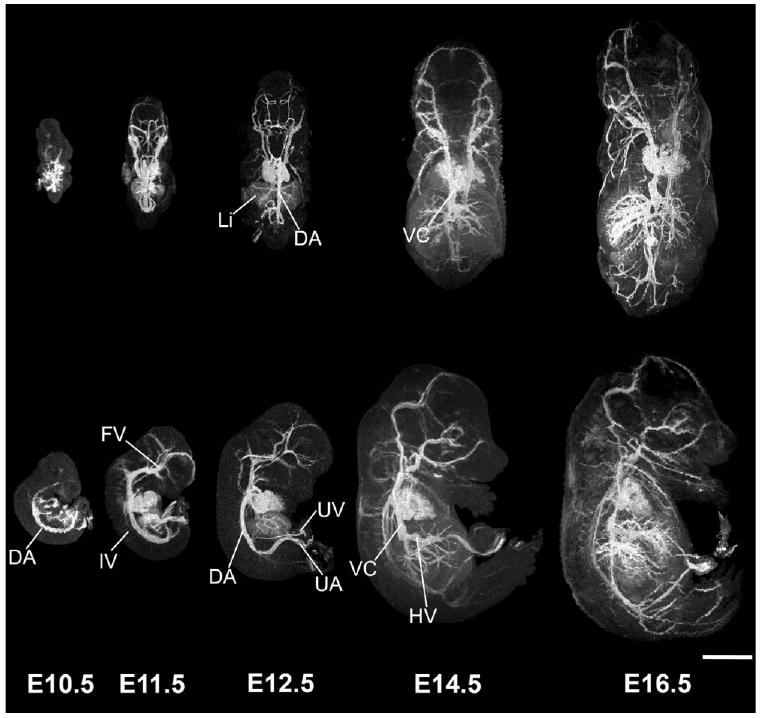
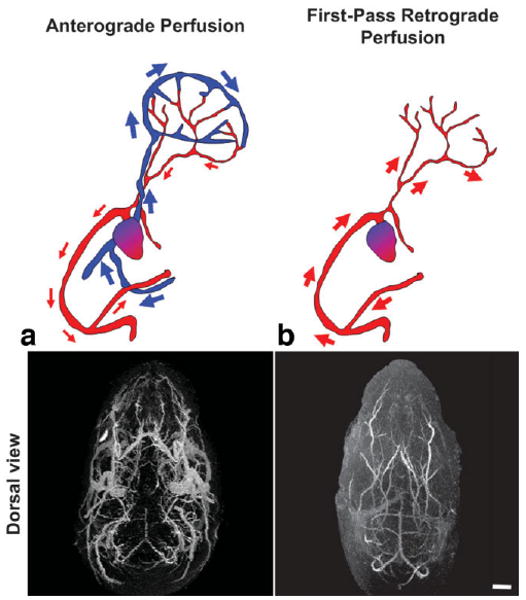
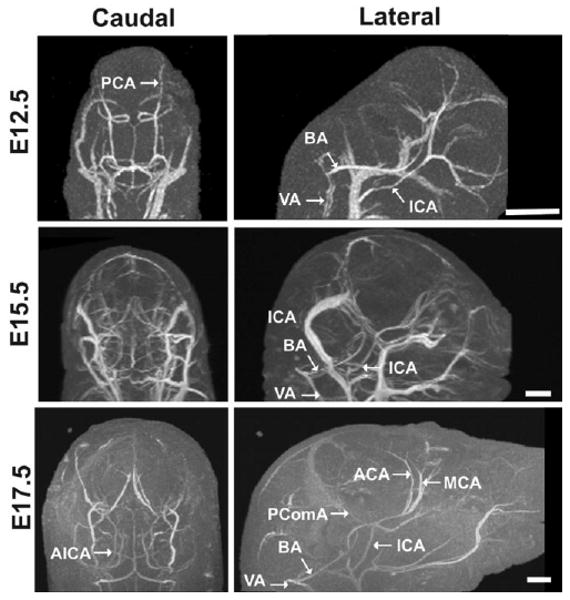
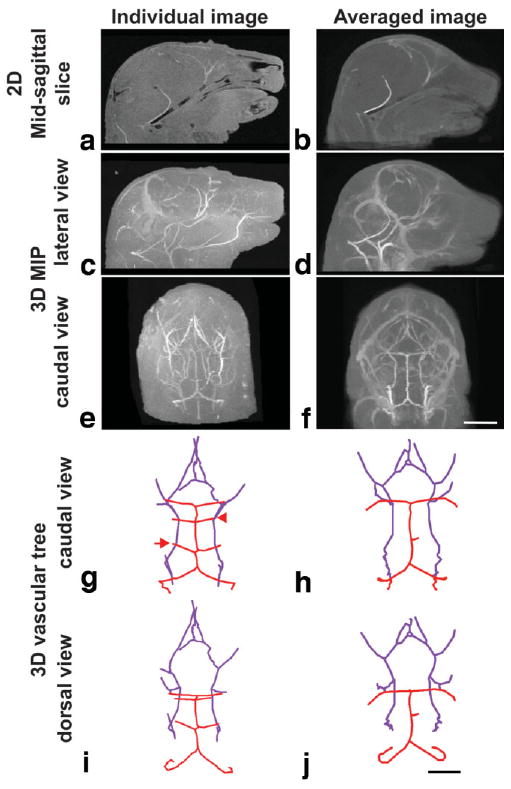
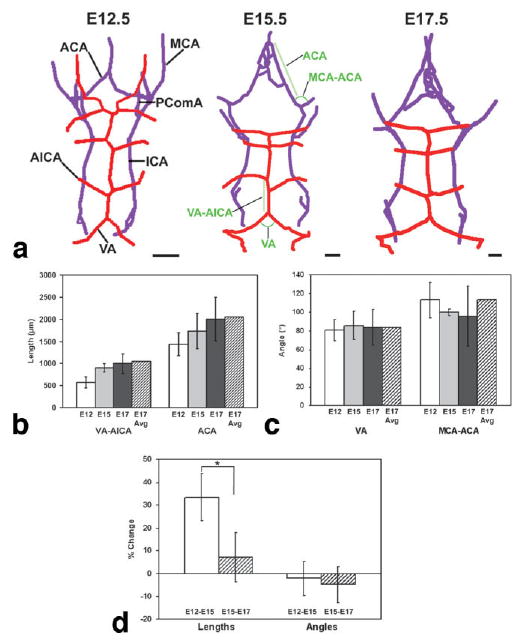
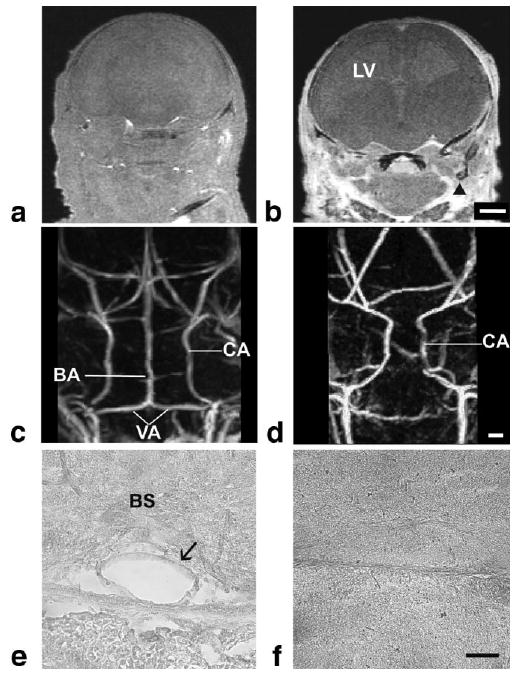
Vascular system development involves a complex, three-dimensional branching process that is critical for normal embryogenesis. In the brain, the arterial systems appear to develop in a stereotyped fashion, but no detailed quantitative analyses of the mouse embryonic cerebral arteries have been described. In this study, a gadolinium-based contrast perfusion method was developed to selectively enhance the cerebral arteries in fixed mouse embryos. Three-dimensional magnetic resonance micro-imaging (micro-MRI) data were acquired simultaneously from multiple embryos staged between 10 and 17 days of gestation, and a variety of image analysis methods was used to extract and analyze the cerebral arterial patterns. The results show that the primary arterial branches in the mouse brain are very similar between individuals, with the patterns established early and growth occurring by extension of the segments, while maintaining the underlying vascular geometry. To investigate the utility of this method for mutant mouse phenotype analysis, contrast-enhanced micro-MRI data were acquired from Gli2(-/-) mutant embryos and their wild-type littermates, showing several previously unreported vascular phenotypes in Gli2(-/-) embryos, including the complete absence of the basilar artery. These results demonstrate that contrast-enhanced micro-MRI provides a powerful tool for analyzing vascular phenotypes in a variety of genetically engineered mice.


Figures

FIG. 1
FIG. 1
Contrast agent perfusion-fixation was used for vascular imaging. a: Embryos were carefully extracted from pregnant anesthetized female ICR mice and incisions were made in both the umbilical artery and vein, through which perfusion of fixative and contrast agent was performed with glass microcapillary needles. b: Multiple embryos were mounted onto the plunger of a 30-mL syringe and (c) imaged simultaneously in a quadrature Litz coil. In the example shown in (b), 6 E12.5 embryos (*) were mounted together with one E13.5 embryo.
FIG. 2
FIG. 2
Image processing methods for visualizing the embryonic vasculature. a: After micro-MRI, surface rendering shows the full 3D dataset from an E12.5 mouse embryo. Coronal (green frame, b) and sagittal (red frame, c) sections demonstrate the contrast agent filling the embryonic vascular spaces. d: 3D MIP of the same data, viewed from the side, reveals the full extent of the contrast-enhanced vascular system. Scale bar = 1 mm.
FIG. 3
FIG. 3
3D MIPs show the developing vasculature. Individual embryos, staged between E10.5 and E16.5 are viewed dorsally (top panels) and from the side (bottom panels), showing the increase in vascular pattern complexity at each developmental stage. Abbreviations: dorsal aorta, DA; vena cava, VC; intersomitic vessels, IV; facial vein, FV; umbilical vein, UV; umbilical artery, UA. Scale bar = 2.5 mm.
FIG. 4
FIG. 4
Modified perfusion protocol to enhance the cerebral arteries. a: Anterograde perfusion through the umbilical vein of an E17.5 embryo enhances both the venous and arterial blood vessels in the brain and head, as viewed from above (dorsal). b: First-pass retrograde perfusion through the umbilical artery of an E17.5 embryo selectively enhances the cerebral arteries. Scale bar = 1-mm.
FIG. 5
FIG. 5
Micro-MRI demonstrated cerebral artery development from E12.5 to E17.5. Views from the back (caudal; left panels) and side (lateral; right panels) show the cerebral vasculature of E12.5 (top panels), E15.5 (middle), and E17.5 (bottom panels) embryos using the first-pass retrograde perfusion method. Venous structures were most effectively eliminated at E17.5, but the major cerebral arteries were easily visualized at all three stages. Abbreviations: basilar artery, BA; anterior inferior cerebellar artery, AICA; posterior cerebral artery, PCA posterior communicating artery, PComA; middle cerebral artery, MCA; anterior cerebral artery, ACA; internal carotid arteries, ICA; vertebral arteries, VA. Scale bars = 1 mm.
FIG. 6
FIG. 6
Image registration and averaging were performed to identify regions of similarity in the cerebral arteries. Differences are shown between an individual E17.5 embryo (left panels), and the registered/averaged image of six E17.5 embryos (right panels). Shown are 2D sagittal slices (a,b); lateral (c,d) and caudal (e,f) views of the MIPs and the extracted 3D vascular trees in caudal (g,h) and dorsal (i,j) views. In the vascular trees, the basilar artery system is shown in red, while the carotid artery system is in purple. Note the presence of the anterior inferior cerebellar artery (AICA, arrow) and the superior cerebellar artery (SCA, arrowhead) in the individual vascular trees not present in the registered/averaged trees. Scale bars = 250 μm. 1.75 mm (a–f); 1.5 mm (g–j).
FIG. 7
FIG. 7
3D vascular trees were extracted and analyzed quantitatively. a: Vascular trees were extracted automatically, showing the basilar artery system (red) and the carotid artery system (purple) from a caudal (back) view at three stages: E12.5 (left); E15.5 (middle); and E17.5 (right). Abbreviations: anterior cerebral artery, ACA; anterior inferior cerebellar artery, AICA; internal carotid artery, ICA; middle cerebral artery, MCA; posterior communicating artery, PComA; vertebral artery, VA. Scale bars = 1 mm. Quantitative analysis of selected angles (b) and segment lengths (c) was performed at E12.5 (white bar), E15.5 (light gray bar) and E17.5 (dark gray bar), where the error bars indicate the standard deviations in each measurement. The lengths and angles shown in (b,c) are indicated in green on the middle panel of (a). The lengths and angles were also measured in the registered and averaged E17.5 images (hatched bars). c: Analysis of six lengths and six angles demonstrated a significant change in length between E12.5 and E15.5, compared to the same branches between E15.5 and E17.5 (*P < 0.05; N = 6), while there were no significant changes in the angles.
FIG. 8
FIG. 8
Gli2-/- mutant mice have severe vascular phenotypes. 3D coronal slices of E17.5 wild-type (a) and Gli2-/- (b) embryos show obvious leakage of contrast agent into extravascular spaces (arrow) in the mutants. Caudal views of the MIPs from wild-type (c) and Gli2-/- (d) mice, showing the carotid arteries (CA) in both, with a constriction in the carotid arteries as they enter the brain in mutant embryos and a complete absence of the basilar artery (BA). Histology was used to confirm the obvious presence of the BA in wild-type embryos (e, arrow) and its absence in Gli2-/- mutants (f). Abbreviations: basilar artery, BA; carotid artery, CA; vertebral arteries, VA; brain stem, BS; lateral ventricle, LV. Scale bar (a,b) = 1 mm; scale bar (c,d) = 275 μm; scale bar (e,f) = 50 μm.

References

    1. Risau W, Flamme I. Vasculogenesis. Annu Rev Cell Dev Biol. 1995;11:73–91. - PubMed
    1. Carmeliet P. Angiogenesis in life, disease and medicine. Nature. 2005;438:932–936. - PubMed
    1. Silvestre JS, Mallat Z, Tedgui A, Levy BI. Post-ischaemic neovascularization and inflammation. Cardiovasc Res. 2008;78:242–249. - PubMed
    1. Kerbel RS. Tumor angiogenesis. New Engl J Med. 2008;358:2039–2049. - PMC - PubMed
    1. Mo R, Freer AM, Zinyk DL, Crackower MA, Michaud J, Heng HH, Chik KW, Shi XM, Tsui LC, Cheng SH, Joyner AL, Hui C. Specific and redundant functions of Gli2 and Gli3 zinc finger genes in skeletal patterning and development. Development. 1997;124:113–123. - PubMed

Publication types

MeSH terms

LinkOut - more resources