

Dynamics of activation of lecithin:cholesterol acyltransferase by apolipoprotein A-I
- PMID: 19860440
- PMCID: PMC2814595
- DOI: 10.1021/bi901242k
Dynamics of activation of lecithin:cholesterol acyltransferase by apolipoprotein A-I
Abstract
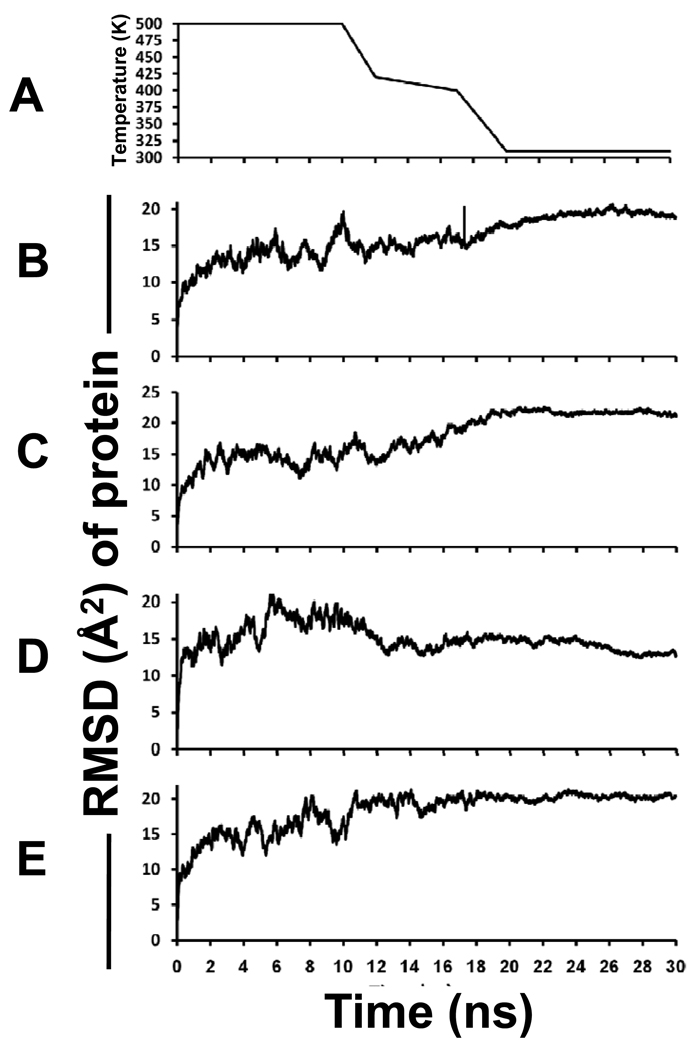
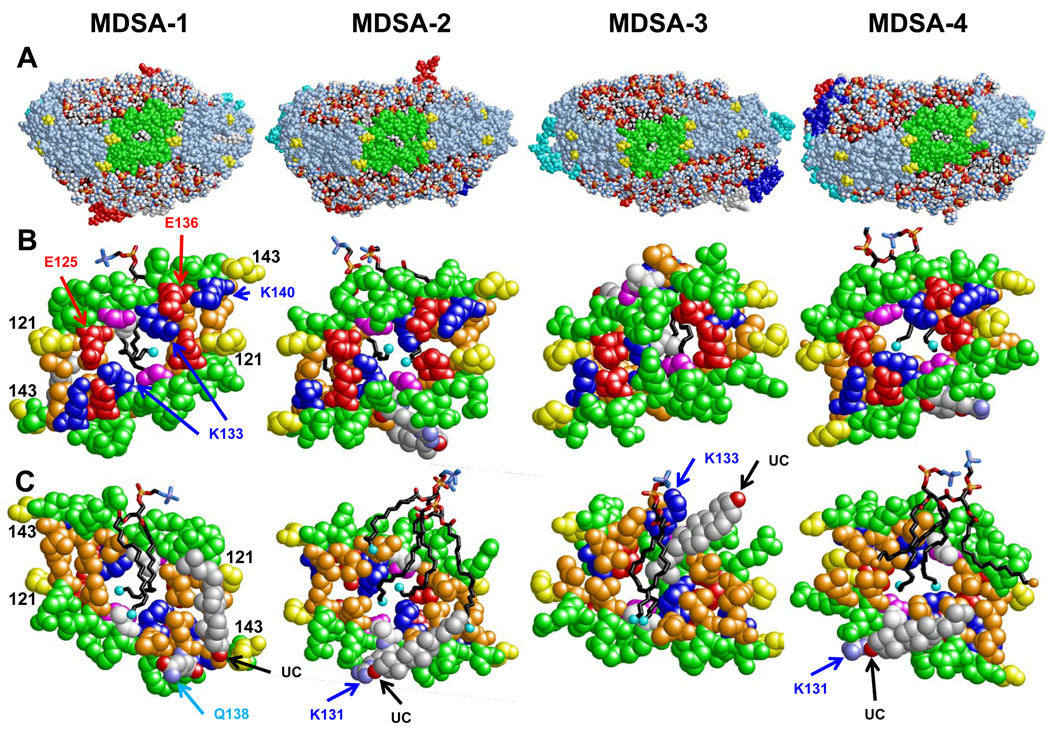
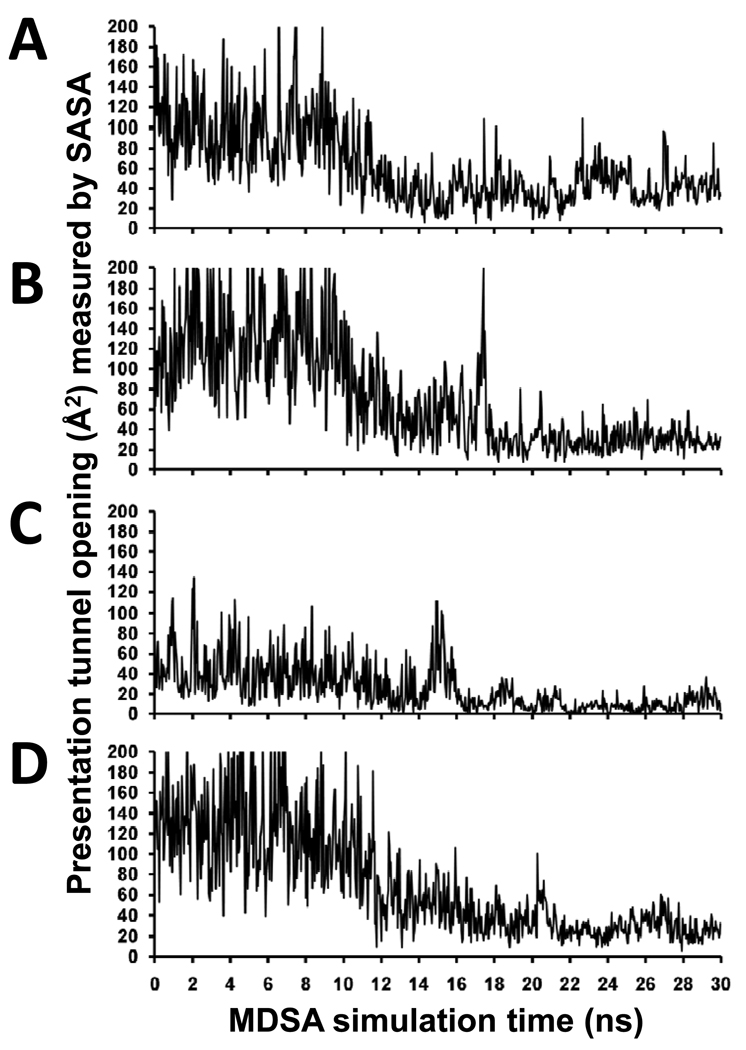
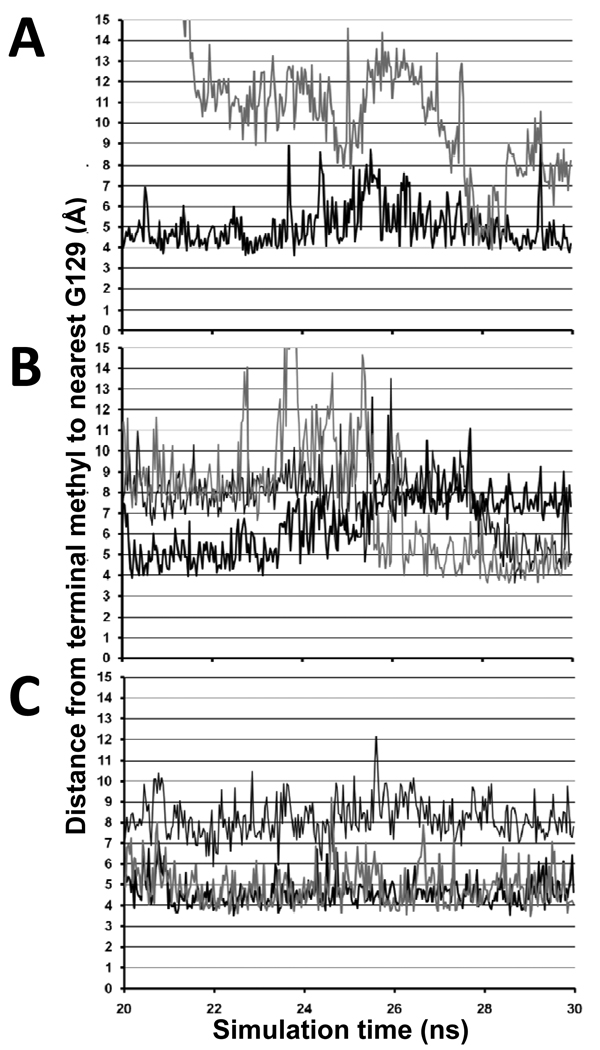
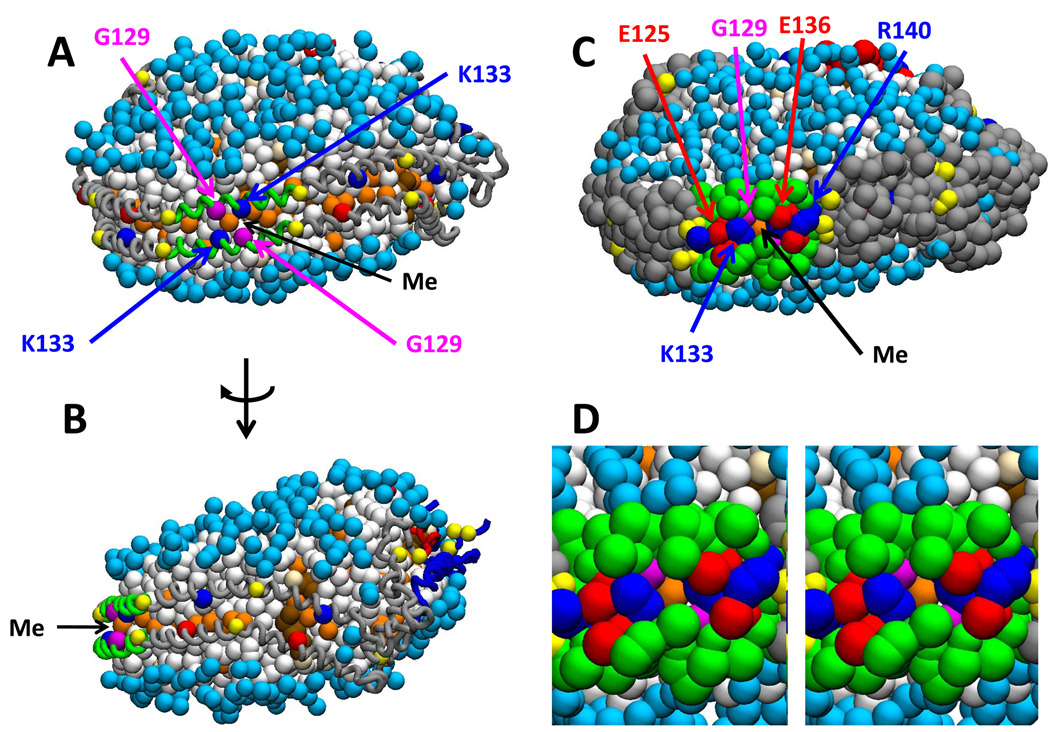
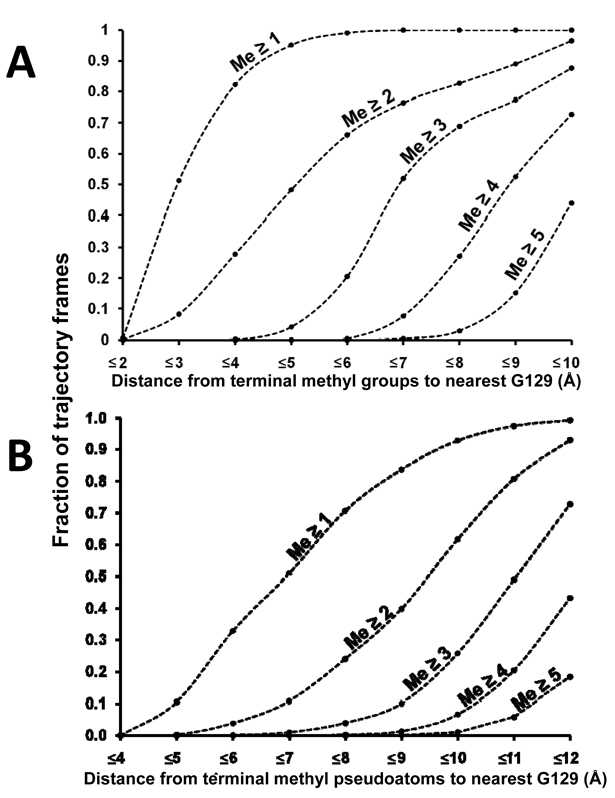
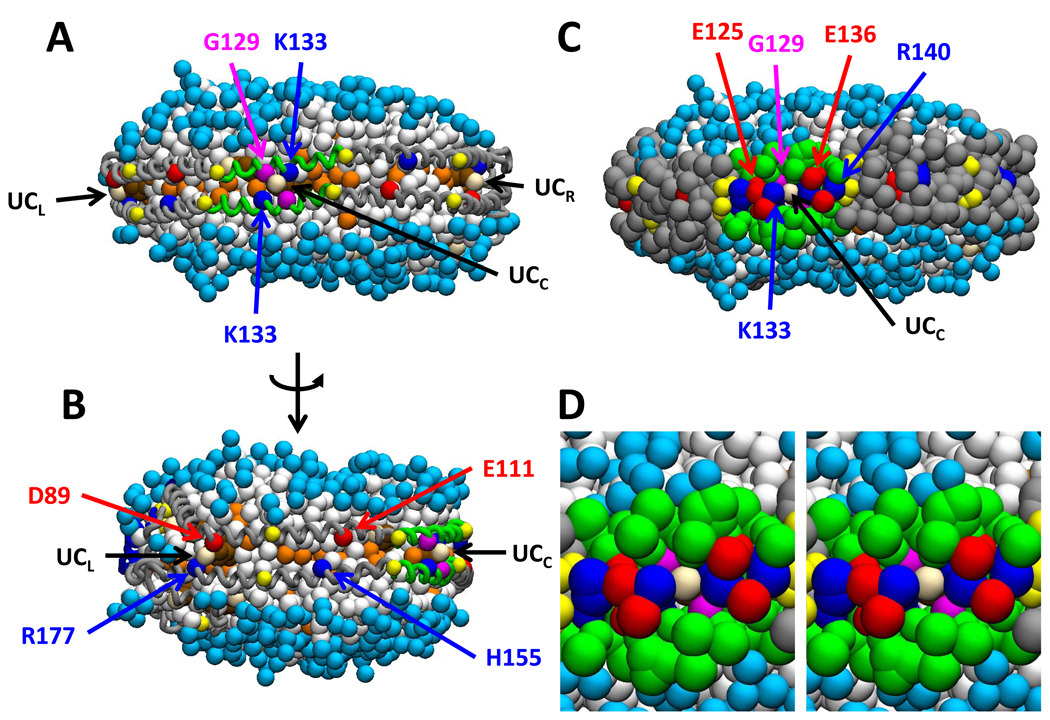
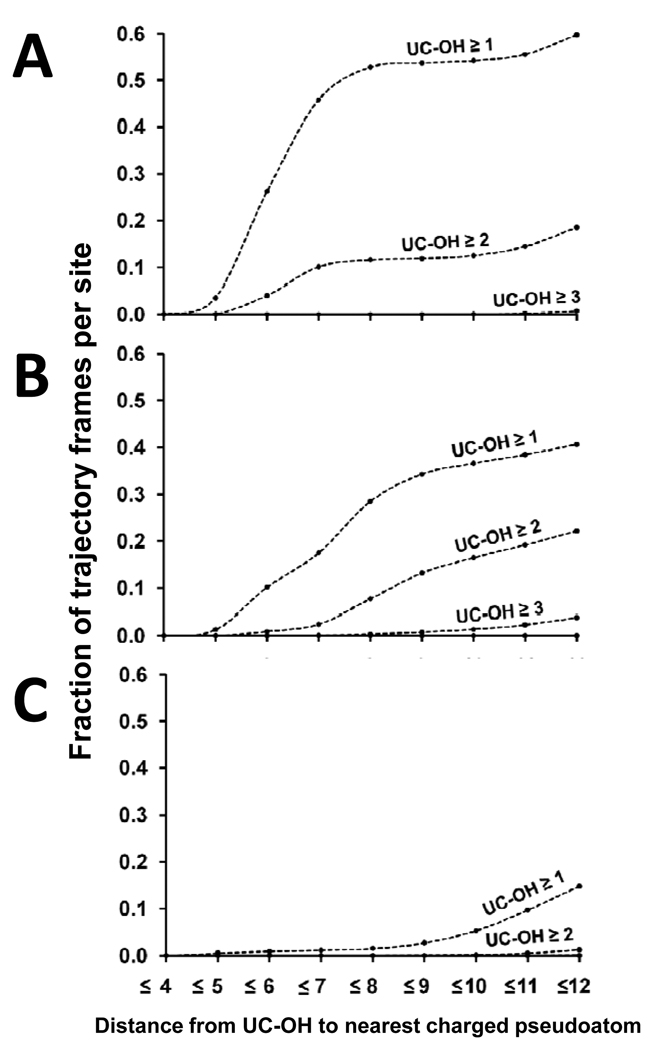
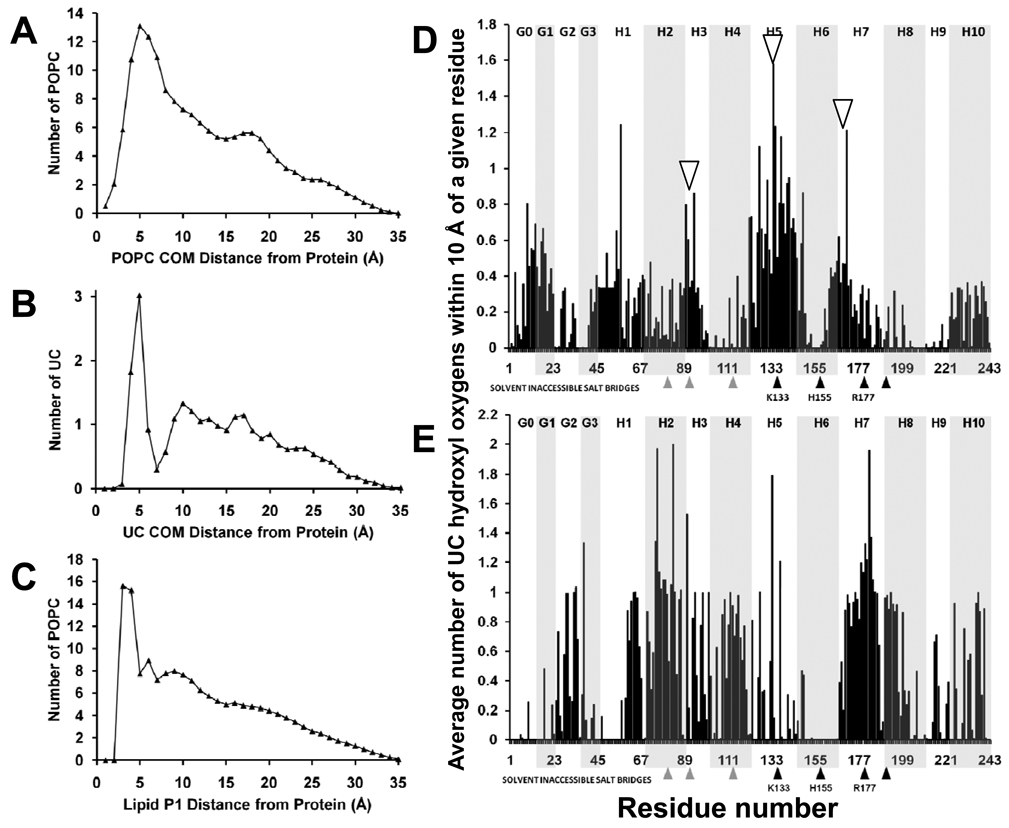
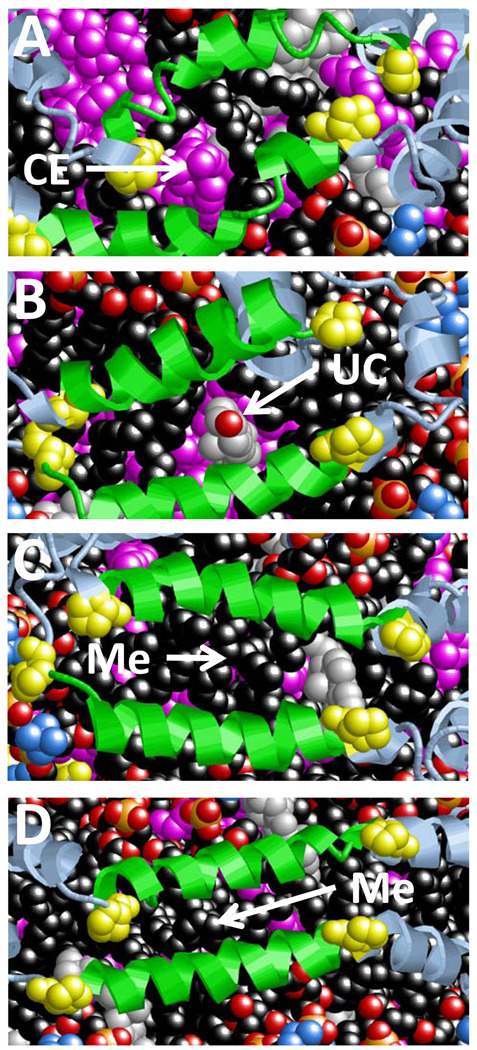
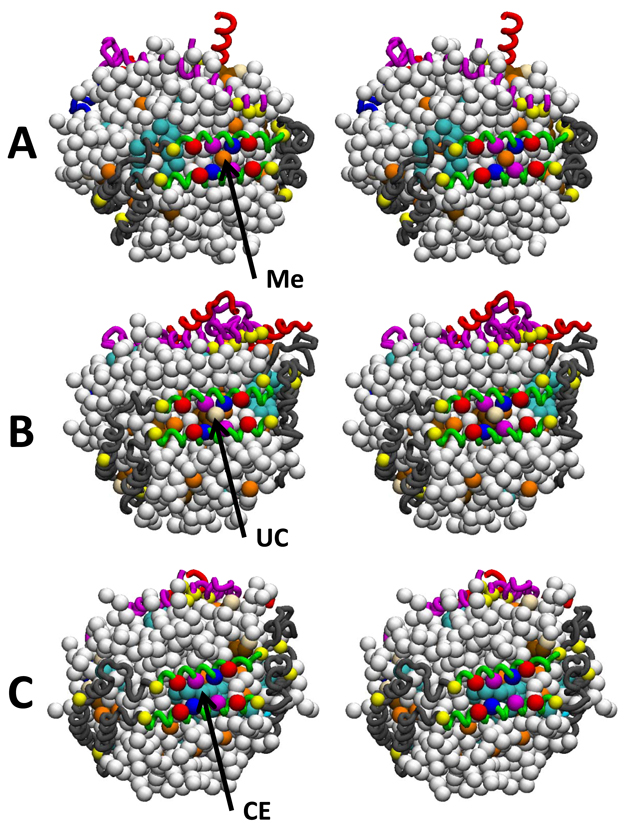
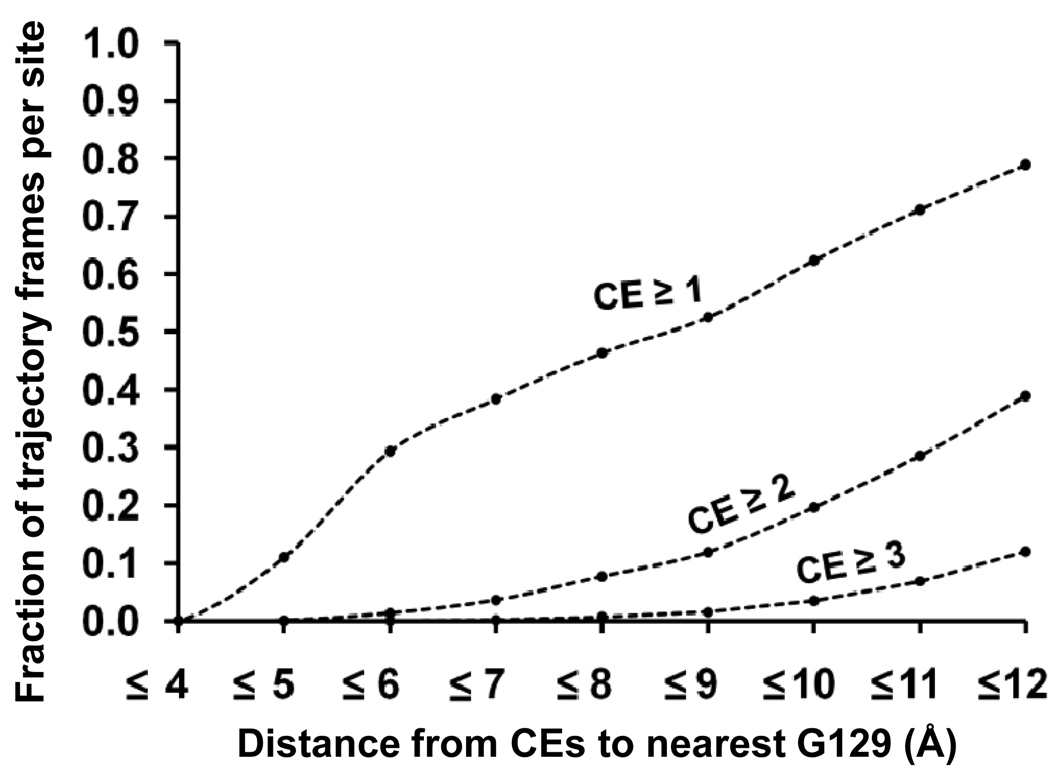
The product of transesterification of phospholipid acyl chains and unesterified cholesterol (UC) by the enzyme lecithin:cholesterol acyltransferase (LCAT) is cholesteryl ester (CE). Activation of LCAT by apolipoprotein (apo) A-I on nascent (discoidal) high-density lipoproteins (HDL) is essential for formation of mature (spheroidal) HDL during the antiatherogenic process of reverse cholesterol transport. Here we report all-atom and coarse-grained (CG) molecular dynamics (MD) simulations of HDL particles that have major implications for mechanisms of LCAT activation. Both the all-atom and CG simulations provide support for a model in which the helix 5/5 domains of apoA-I create an amphipathic "presentation tunnel" that exposes methyl ends of acyl chains at the bilayer center to solvent. Further, CG simulations show that UC also becomes inserted with high efficiency into the amphipathic presentation tunnel with its hydroxyl moiety (UC-OH) exposed to solvent; these results are consistent with trajectory analyses of the all-atom simulations showing that UC is being concentrated in the vicinity of the presentation tunnel. Finally, consistent with known product inhibition of CE-rich HDL by CE, CG simulations of CE-rich spheroidal HDL indicate partial blockage of the amphipathic presentation tunnel by CE. These results lead us to propose the following working hypothesis. After attachment of LCAT to discoidal HDL, the helix 5/5 domains in apoA-I form amphipathic presentation tunnels for migration of hydrophobic acyl chains and amphipathic UC from the bilayer to the phospholipase A2-like and esterification active sites of LCAT, respectively. This hypothesis is currently being tested by site-directed mutagenesis.
Figures
Similar articles
-
Arginine 123 of apolipoprotein A-I is essential for lecithin:cholesterol acyltransferase activity.J Lipid Res. 2018 Feb;59(2):348-356. doi: 10.1194/jlr.M080986. Epub 2017 Dec 5. J Lipid Res. 2018. PMID: 29208698 Free PMC article.
-
Effect of the surface lipid composition of reconstituted LPA-I on apolipoprotein A-I structure and lecithin: cholesterol acyltransferase activity.Biochim Biophys Acta. 1998 Feb 16;1390(2):160-72. doi: 10.1016/s0005-2760(97)00172-0. Biochim Biophys Acta. 1998. PMID: 9507105
-
Interaction of lecithin:cholesterol acyltransferase with lipid surfaces and apolipoprotein A-I-derived peptides.J Lipid Res. 2018 Apr;59(4):670-683. doi: 10.1194/jlr.M082685. Epub 2018 Feb 8. J Lipid Res. 2018. PMID: 29438987 Free PMC article.
-
Advances in understanding of the role of lecithin cholesterol acyltransferase (LCAT) in cholesterol transport.Clin Chim Acta. 1999 Aug;286(1-2):257-71. doi: 10.1016/s0009-8981(99)00106-0. Clin Chim Acta. 1999. PMID: 10511297 Review.
-
Apolipoprotein A-I: structure-function relationships.J Lipid Res. 2000 Jun;41(6):853-72. J Lipid Res. 2000. PMID: 10828078 Review.
Cited by
-
Rotational and hinge dynamics of discoidal high density lipoproteins probed by interchain disulfide bond formation.Biochim Biophys Acta. 2012 Mar;1821(3):481-9. doi: 10.1016/j.bbalip.2011.10.013. Epub 2011 Oct 19. Biochim Biophys Acta. 2012. PMID: 22063273 Free PMC article.
-
Arginine 123 of apolipoprotein A-I is essential for lecithin:cholesterol acyltransferase activity.J Lipid Res. 2018 Feb;59(2):348-356. doi: 10.1194/jlr.M080986. Epub 2017 Dec 5. J Lipid Res. 2018. PMID: 29208698 Free PMC article.
-
"Sticky" and "promiscuous", the yin and yang of apolipoprotein A-I termini in discoidal high-density lipoproteins: a combined computational-experimental approach.Biochemistry. 2011 Mar 29;50(12):2249-63. doi: 10.1021/bi101301g. Epub 2011 Mar 4. Biochemistry. 2011. PMID: 21329368 Free PMC article.
-
Structure of apolipoprotein A-I N terminus on nascent high density lipoproteins.J Biol Chem. 2011 Jan 28;286(4):2966-75. doi: 10.1074/jbc.M110.163097. Epub 2010 Nov 3. J Biol Chem. 2011. PMID: 21047795 Free PMC article.
-
Apolipoprotein A1 -75 G/A and +83 C/T polymorphisms: susceptibility and prognostic implications in breast cancer.Mol Biol Rep. 2011 Mar;38(3):1637-43. doi: 10.1007/s11033-010-0274-0. Epub 2010 Sep 15. Mol Biol Rep. 2011. PMID: 20842444
References
-
- Nichols AV, Blanche PJ, Gong EL, Shore VG, Forte TM. Molecular pathways in the transformation of model discoidal lipoprotein complexes induced by lecithin:cholesterol acyltransferase. Biochim Biophys Acta. 1985;834:285–300. - PubMed
-
- Linsel-Nitschke P, Tall AR. HDL as a target in the treatment of atherosclerotic cardiovascular disease. Nat Rev Drug Discov. 2005;4:193–205. - PubMed
-
- Segrest JP, Jones MK, Klon AE, Sheldahl CJ, Hellinger M, De Loof H, Harvey SC. A detailed molecular belt model for apolipoprotein A-I in discoidal high density lipoprotein. J Biol Chem. 1999;274:31755–31758. - PubMed
-
- Davidson WS, Hilliard GM. The spatial organization of apolipoprotein A-I on the edge of discoidal high density lipoprotein particles: a mass specrometry study. J Biol Chem. 2003;278:27199–27207. - PubMed
-
- Bhat S, Sorci-Thomas MG, Alexander ET, Samuel MP, Thomas MJ. Intermolecular contact between globular N-terminal fold and C-terminal domain of ApoA-I stabilizes its lipid-bound conformation: studies employing chemical cross-linking and mass spectrometry. J Biol Chem. 2005;280:33015–33025. - PubMed
Publication types
MeSH terms
Substances
Grants and funding
LinkOut - more resources
Full Text Sources
Miscellaneous
