. 2009 Oct 27:10:69.
doi: 10.1186/1471-2156-10-69.

Developing a set of ancestry-sensitive DNA markers reflecting continental origins of humans

Affiliations

Developing a set of ancestry-sensitive DNA markers reflecting continental origins of humans

Paula Kersbergen et al. BMC Genet. .

Abstract

Background: The identification and use of Ancestry-Sensitive Markers (ASMs), i.e. genetic polymorphisms facilitating the genetic reconstruction of geographical origins of individuals, is far from straightforward.

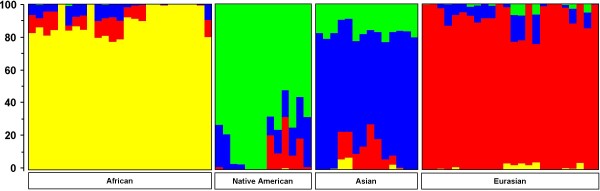
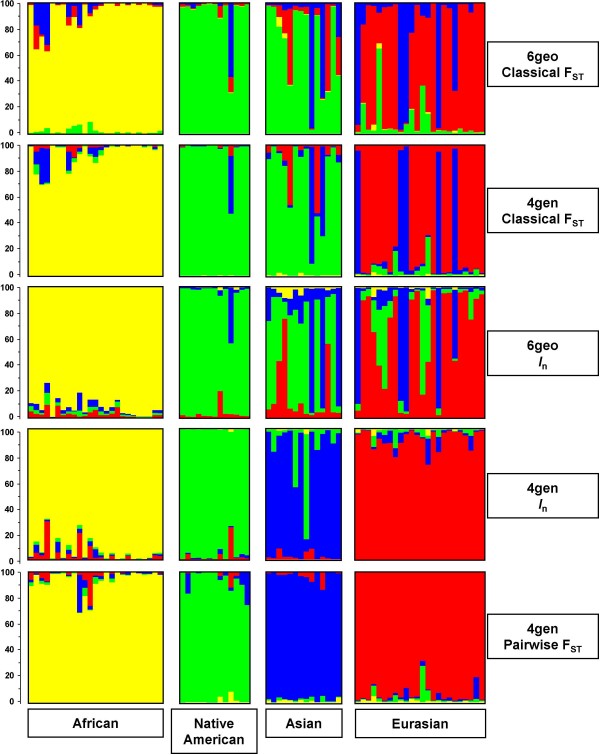
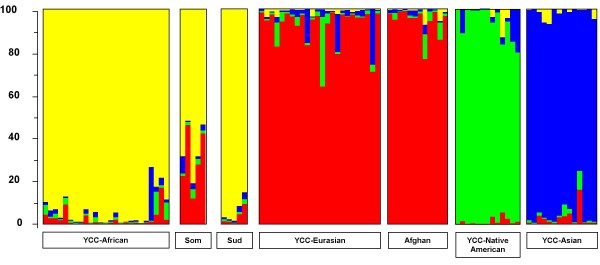
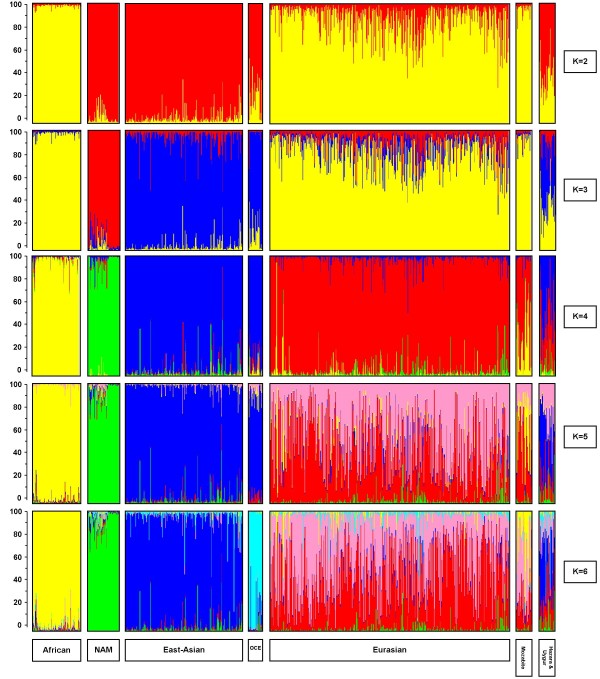
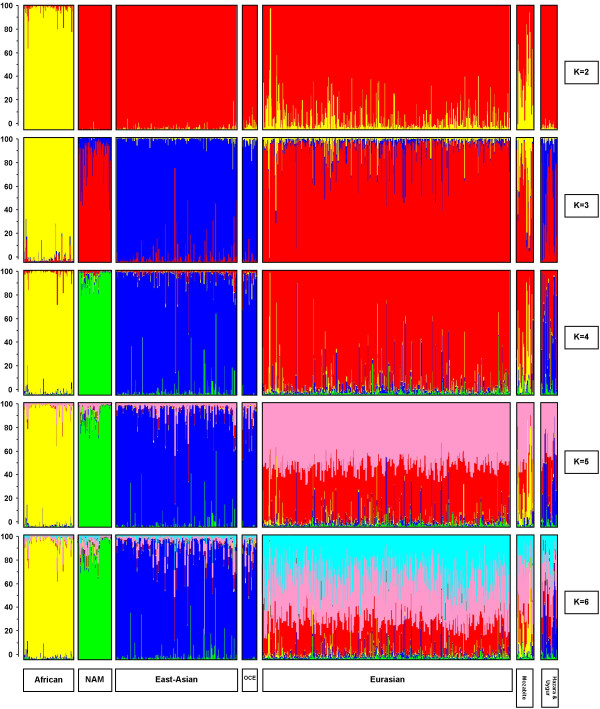
Results: Here we describe the ascertainment and application of five different sets of 47 single nucleotide polymorphisms (SNPs) allowing the inference of major human groups of different continental origin. For this, we first used 74 cell lines, representing human males from six different geographical areas and screened them with the Affymetrix Mapping 10K assay. In addition to using summary statistics estimating the genetic diversity among multiple groups of individuals defined by geography or language, we also used the program STRUCTURE to detect genetically distinct subgroups. Subsequently, we used a pairwise F(ST) ranking procedure among all pairs of genetic subgroups in order to identify a single best performing set of ASMs. Our initial results were independently confirmed by genotyping this set of ASMs in 22 individuals from Somalia, Afghanistan and Sudan and in 919 samples from the CEPH Human Genome Diversity Panel (HGDP-CEPH) CONCLUSION: By means of our pairwise population F(ST) ranking approach we identified a set of 47 SNPs that could serve as a panel of ASMs at a continental level.


Figures

Figure 1
Figure 1
STRUCTURE analyses of 8,474 SNPs among 74 globally dispersed individuals. A STRUCTURE analysis revealed that the likelihood of the data was maximal at K = 4 ancestral populations (also called subgroups or clusters). Individuals are represented as vertical bars that are partitioned into segments corresponding to their membership of the clusters indicated by the four different colours. Each colour reflects the estimated relative contribution of one of the four clusters to that individual's genome and sum up to 100% (indicated at the Y-axis). Individuals were sorted according to their geographical origins (indicated below each group) after completion of the STRUCTURE analyses. E.g. for the left-most individual, sampled in Africa, there is about 82% relative contribution of the ancestral population represented by yellow, about 6% is attributed to the blue ancestral population and the remaining 12% is attributed to the red ancestral population. From this figure it becomes clear that this could be interpreted as a contribution of 82% - 12% - 6% of African, European, and Asian "genes" to the genome of this African individual. The results in this figure are based on the 8,474 SNPs genotyped in the 74 YCC cell lines from individuals from Africa (n = 25), Native American origin (n = 12), Asia (n = 14), and Eurasia (n = 23).
Figure 2
Figure 2
Different approaches for the ascertainment of ASMs. The five panels show the results from STRUCTURE analyses for five different sets of 47 ancestry sensitive markers (ASMs) among 74 globally dispersed individuals from Africa (n = 25), Native American origin (n = 12), Asia (n = 14), and Eurasia (n = 23). To the right of each panel we indicate which statistical approach is used to identify each set of ASMs (see methods for more details). For each set of 47 ASMs, the likelihood of the data was maximal at K = 4 ancestral populations (clusters). Individuals are represented as vertical bars that are partitioned into to segments corresponding to their membership of the clusters indicated by the four different colours. Each colour reflects the estimated relative contribution of one of the four subgroups to that individual's genome and sum up to 100% (indicated at the Y-axis). Individuals were sorted according to their geographical origins (indicated below each group) after completion of the STRUCTURE analyses.
Figure 3
Figure 3
STRUCTURE results after adding additional individuals to the YCC panel, based on 47 ASMs. Genotypes of the 47 ASMs ascertained by the 4gen pairwise FST approach from 22 individuals from Somalia, Afghanistan, and Sudan, were added to the genotypes of the original 74 YCC samples. After STRUCTURE analyses, the likelihood of the data was maximal at K = 4 ancestral populations (or clusters). Individuals are represented as vertical bars that are partitioned into segments corresponding to their membership of the clusters indicated by the four different colours. Each colour reflects the estimated relative contribution of one of the four clusters to that individual's genome and sum up to 100% (indicated at the Y-axis). Individuals were sorted according to their geographical origins (indicated below each group) after completion of the STRUCTURE analyses.
Figure 4
Figure 4
STRUCTURE results with 47 ASMs in the HGDP. The five horizontal groups show the results from STRUCTURE analyses for the H919 dataset genotyped for the 47 ASMs (ascertained with 4gen pairwise FST) as proof of principle. We explored the estimated proportion of contribution of K ancestral populations (or clusters or subgroups) varying K from two to six. Individuals are represented as vertical bars that are partitioned into segments corresponding to their membership of the clusters indicated by two to six different colours. Each colour reflects the estimated relative contribution of one of the four subgroups to that individual's genome and sum up to 100% (indicated at the Y-axis). Individuals were sorted according to their geographical origins (indicated below each group) after completion of the STRUCTURE analyses.
Figure 5
Figure 5
STRUCTURE results with 34 ASMs in the HGDP. The five horizontal groups show the results from STRUCTURE analyses for the H919 dataset genotyped for the reduced set of 34 ASMs (ascertained with 4gen pairwise FST). We explored the estimated proportion of contribution of K ancestral populations (or clusters or subgroups) varying K from two to six. Individuals are represented as vertical bars that are partitioned into segments corresponding to their membership of the clusters indicated by two to six different colours. Each colour reflects the estimated relative contribution of one of the four subgroups to that individual's genome and sum up to 100% (indicated at the Y-axis). Individuals were sorted according to their geographical origins (indicated below each group) after completion of the STRUCTURE analyses.

References

    1. Shriver M, Frudakis T, Budowle B. Getting the science and the ethics right in forensic genetics. Nat Genet. 2005;37:449–50. doi: 10.1038/ng0505-449. - DOI - PubMed
    1. Ray DA, Walker JA, Hall A, Llewellyn B, Ballantyne J, Christian AT, Turteltaub K, Batzer MA. Inference of human geographic origins using Alu insertion polymorphisms. Forensic Sci Int. 2005;153:117–24. doi: 10.1016/j.forsciint.2004.10.017. - DOI - PubMed
    1. Frudakis T, Venkateswarlu K, Thomas MJ, Gaskin Z, Ginjupalli S, Gunturi S, Ponnuswamy V, Natarajan S, Nachimuthu PK. A classifier for the SNP-based inference of ancestry. J Forensic Sci. 2003;48:771–82. - PubMed
    1. The (current) articles 138a, 151d and 195f of the "wetboek van strafvordering" (the Dutch Criminal Penal Code are available (in Dutch only) online at the following starting page http://wetten.overheid.nl/BWBR0001903/geldigheidsdatum_20-10-2009
    1. Shriver MD, Parra EJ, Dios S, Bonilla C, Norton H, Jovel C, Pfaff C, Jones C, Massac A, Cameron N, Baron A, Jackson T, Argyropoulos G, Jin L, Hoggart CJ, McKeigue PM, Kittles RA. Skin pigmentation, biogeographical ancestry and admixture mapping. Hum Genet. 2003;112:387–99. - PubMed

Publication types

Substances

LinkOut - more resources