

Estimating the phylogeny and divergence times of primates using a supermatrix approach
- PMID: 19860891
- PMCID: PMC2774700
- DOI: 10.1186/1471-2148-9-259
Estimating the phylogeny and divergence times of primates using a supermatrix approach
Abstract
Background: The primates are among the most broadly studied mammalian orders, with the published literature containing extensive analyses of their behavior, physiology, genetics and ecology. The importance of this group in medical and biological research is well appreciated, and explains the numerous molecular phylogenies that have been proposed for most primate families and genera. Composite estimates for the entire order have been infrequently attempted, with the last phylogenetic reconstruction spanning the full range of primate evolutionary relationships having been conducted over a decade ago.
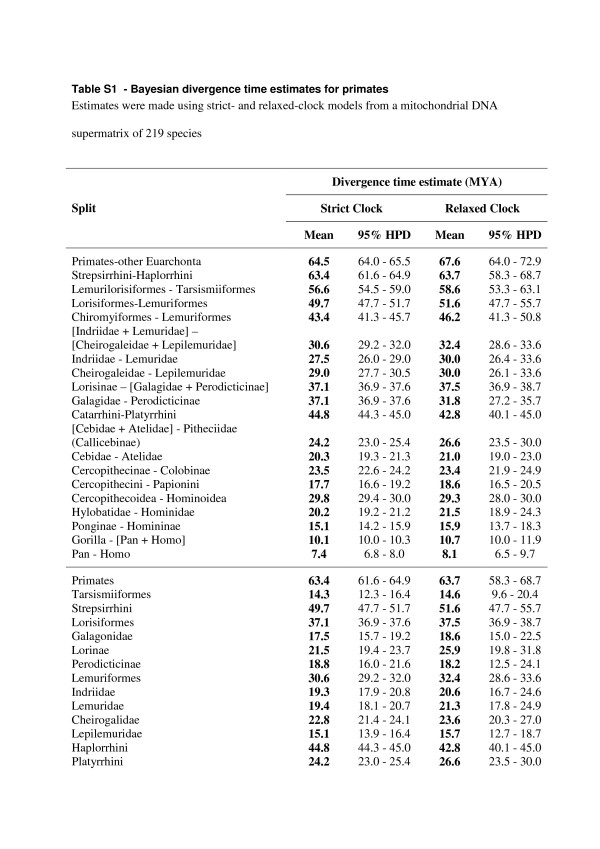
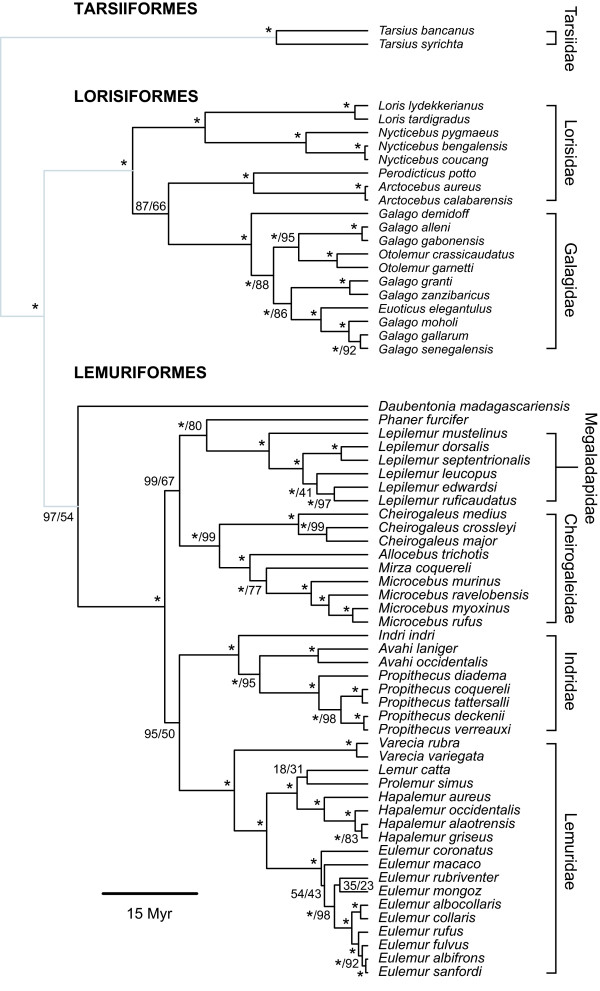
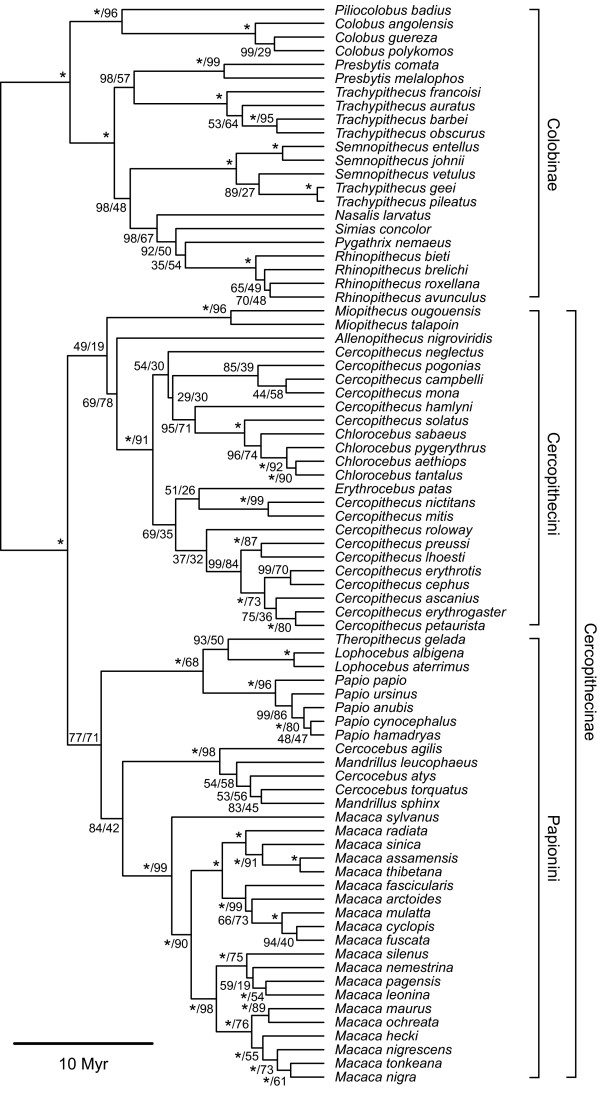
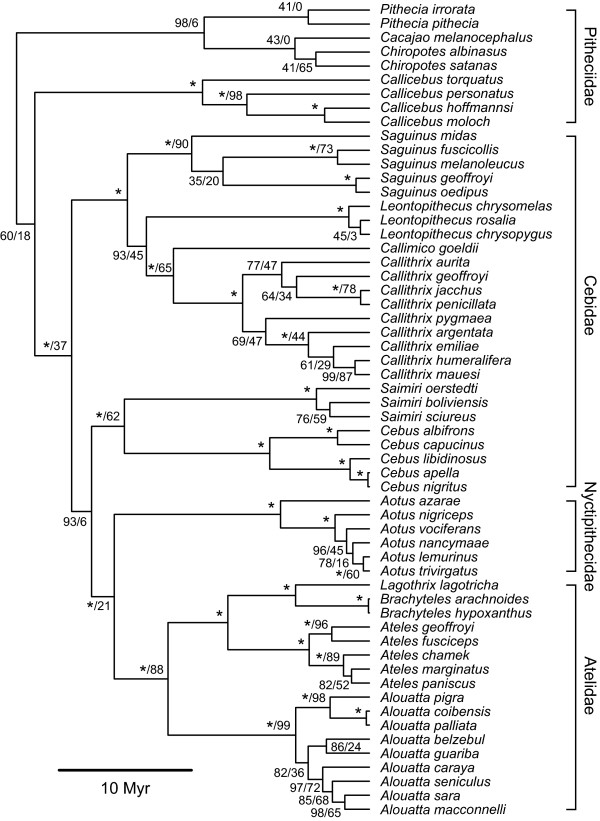
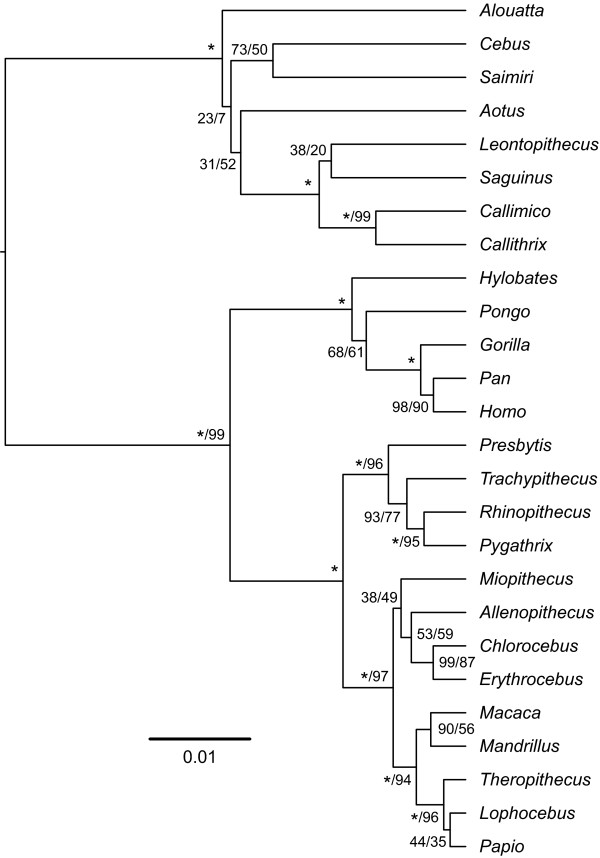
Results: To estimate the structure and tempo of primate evolutionary history, we employed Bayesian phylogenetic methods to analyze data supermatrices comprising 7 mitochondrial genes (6,138 nucleotides) from 219 species across 67 genera and 3 nuclear genes (2,157 nucleotides) from 26 genera. Many taxa were only partially represented, with an average of 3.95 and 5.43 mitochondrial genes per species and per genus, respectively, and 2.23 nuclear genes per genus. Our analyses of mitochondrial DNA place Tarsiiformes as the sister group of Strepsirrhini. Within Haplorrhini, we find support for the primary divergence of Pitheciidae in Platyrrhini, and our results suggest a sister grouping of African and non-African colobines within Colobinae and of Cercopithecini and Papionini within Cercopthecinae. Date estimates for nodes within each family and genus are presented, with estimates for key splits including: Strepsirrhini-Haplorrhini 64 million years ago (MYA), Lemuriformes-Lorisiformes 52 MYA, Platyrrhini-Catarrhini 43 MYA and Cercopithecoidea-Hominoidea 29 MYA.
Conclusion: We present an up-to-date, comprehensive estimate of the structure and tempo of primate evolutionary history. Although considerable gaps remain in our knowledge of the primate phylogeny, increased data sampling, particularly from nuclear loci, will be able to provide further resolution.
Figures

Similar articles
-
Primate phylogeny, evolutionary rate variations, and divergence times: a contribution from the nuclear gene IRBP.Am J Phys Anthropol. 2004 May;124(1):1-16. doi: 10.1002/ajpa.10322. Am J Phys Anthropol. 2004. PMID: 15085543
-
Molecular evidence on primate phylogeny from DNA sequences.Am J Phys Anthropol. 1994 May;94(1):3-24. doi: 10.1002/ajpa.1330940103. Am J Phys Anthropol. 1994. PMID: 8042704 Review.
-
Molecular phylogeny and evolution of prosimians based on complete sequences of mitochondrial DNAs.Gene. 2009 Jul 15;441(1-2):53-66. doi: 10.1016/j.gene.2008.08.024. Epub 2008 Sep 11. Gene. 2009. PMID: 18824224
-
A mitogenomic phylogeny of living primates.PLoS One. 2013 Jul 16;8(7):e69504. doi: 10.1371/journal.pone.0069504. Print 2013. PLoS One. 2013. PMID: 23874967 Free PMC article.
-
Primate phylogeny: morphological vs. molecular results.Mol Phylogenet Evol. 1996 Feb;5(1):102-54. doi: 10.1006/mpev.1996.0009. Mol Phylogenet Evol. 1996. PMID: 8673281 Review.
Cited by
-
Estimating the rate of irreversibility in protein evolution.Genome Biol Evol. 2012;4(12):1213-22. doi: 10.1093/gbe/evs096. Genome Biol Evol. 2012. PMID: 23132897 Free PMC article.
-
Terrestriality and bacterial transfer: a comparative study of gut microbiomes in sympatric Malagasy mammals.ISME J. 2019 Jan;13(1):50-63. doi: 10.1038/s41396-018-0251-5. Epub 2018 Aug 14. ISME J. 2019. PMID: 30108305 Free PMC article.
-
Context-Dependent Gestural Laterality: A Multifactorial Analysis in Captive Red-Capped Mangabeys.Animals (Basel). 2022 Jan 13;12(2):186. doi: 10.3390/ani12020186. Animals (Basel). 2022. PMID: 35049807 Free PMC article.
-
Factors Regulating the Activity of LINE1 Retrotransposons.Genes (Basel). 2021 Sep 30;12(10):1562. doi: 10.3390/genes12101562. Genes (Basel). 2021. PMID: 34680956 Free PMC article. Review.
-
Epigenetic clock and methylation studies in vervet monkeys.Geroscience. 2022 Apr;44(2):699-717. doi: 10.1007/s11357-021-00466-3. Epub 2021 Sep 30. Geroscience. 2022. PMID: 34591235 Free PMC article.
References
Publication types
MeSH terms
LinkOut - more resources
Full Text Sources
