. 2009 Nov 15;15(22):6947-55.
doi: 10.1158/1078-0432.CCR-09-1132. Epub 2009 Oct 27.

A genomic approach to improve prognosis and predict therapeutic response in chronic lymphocytic leukemia

Affiliations

A genomic approach to improve prognosis and predict therapeutic response in chronic lymphocytic leukemia

Daphne R Friedman et al. Clin Cancer Res. .

Abstract

Purpose: Chronic lymphocytic leukemia (CLL) is a B-cell malignancy characterized by a variable clinical course. Several parameters have prognostic capabilities but are associated with altered response to therapy in only a small subset of patients.

Experimental design: We used gene expression profiling methods to generate predictors of therapy response and prognosis. Genomic signatures that reflect progressive disease and responses to chemotherapy or chemoimmunotherapy were created using cancer cell lines and patient leukemia cell samples. We validated and applied these three signatures to independent clinical data from four cohorts, representing a total of 301 CLL patients.

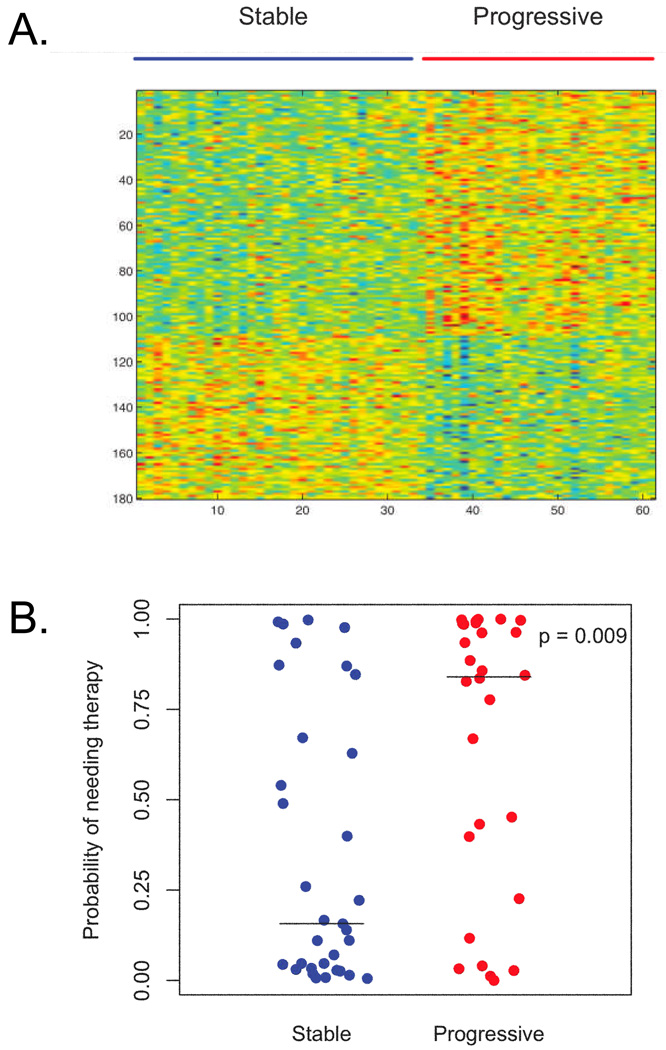
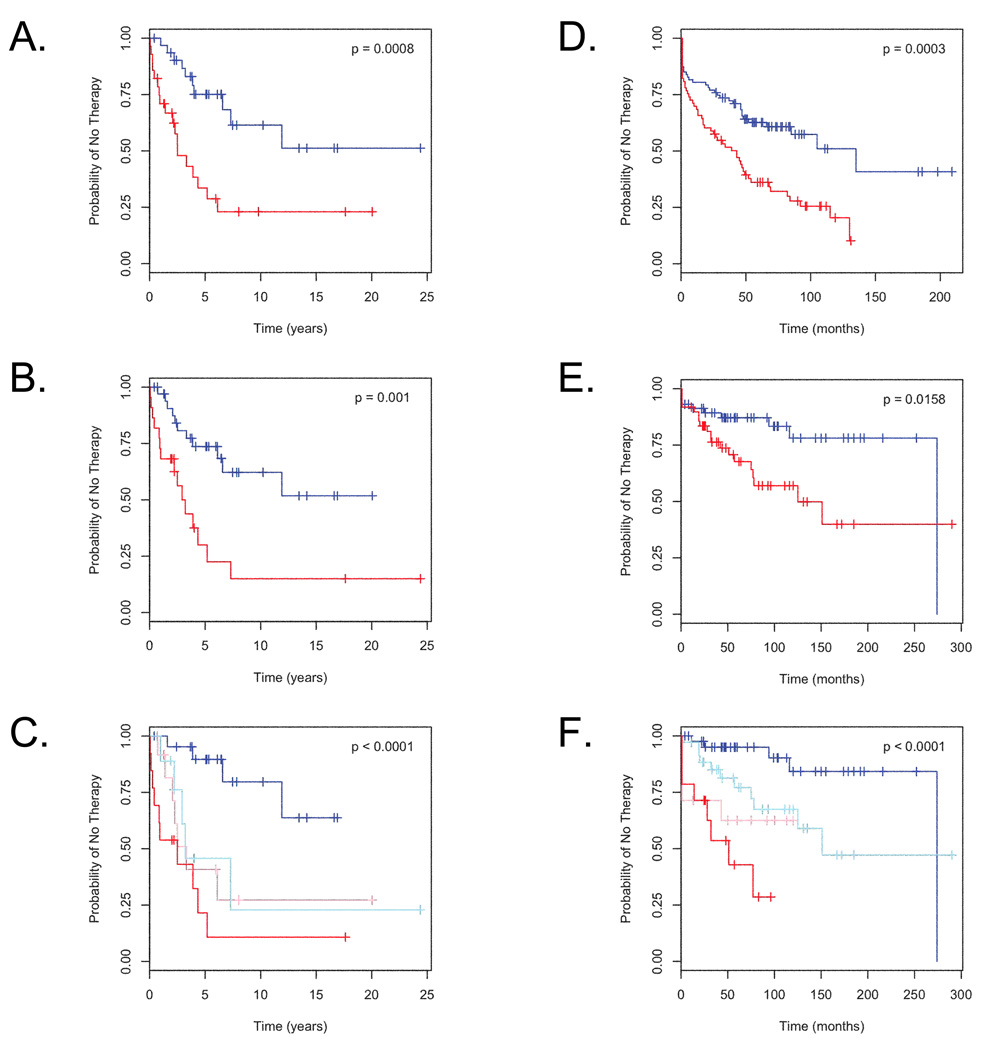
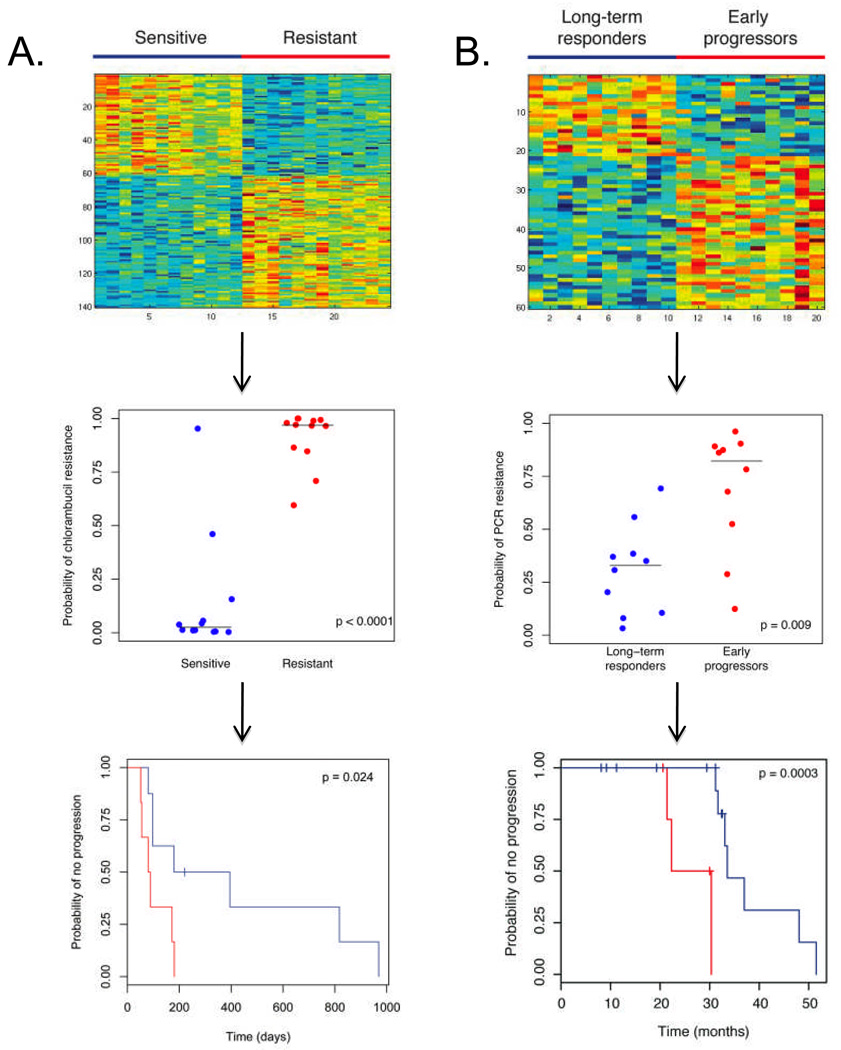
Results: A genomic signature of prognosis created from patient leukemic cell gene expression data coupled with clinical parameters significantly differentiated patients with stable disease from those with progressive disease in the training data set. The progression signature was validated in two independent data sets, showing a capacity to accurately identify patients at risk for progressive disease. In addition, genomic signatures that predict response to chlorambucil or pentostatin, cyclophosphamide, and rituximab were generated and could accurately distinguish responding and nonresponding CLL patients.

Conclusions: Thus, microarray analysis of CLL lymphocytes can be used to refine prognosis and predict response to different therapies. These results have implications for standard and investigational therapeutics in CLL patients.


Figures

Figure 1
Figure 1. Genomic Signature of Disease Progression
Panel A: Heatmap of the 180-gene signature differentiating CLL samples from patients who did not require therapy (stable disease, n = 33 samples) from those who did require therapy (progressive disease, n = 28 samples). Red color represents upregulated genes and blue color represents downregulated genes. Panel B: Leave-one-out cross validation score of fitting the 180-gene signature for the 33 samples in the stable group and the 28 samples in the progressive group. The median values for the stable and progressive groups are denoted by horizontal lines and were 0.157 and 0.840, respectively. P value was determined by Wilcoxon rank sum test.
Figure 2
Figure 2. Refining Prognosis by Combining Genomic Signature Score with IgVH Mutation Status and Validating in Independent Datasets
Panel A: Kaplan-Meier analysis of freedom from therapy in patients predicted to have stable disease by the genomic signature with a score < 0.5 (n = 39, blue color) compared to patients predicted to have progressive disease by the genomic signature with a score of ≥ 0.5 (n = 29, red color). Panel B: Kaplan-Meier analysis of freedom from therapy in patients with mutated IgVH (n = 35, blue color) versus patients with unmutated IgVH (n = 23, red color). Panel C: Kaplan-Meier analysis of freedom from therapy in patients subdivided based on a Cox proportional hazards model. High microarray score (≥ 0.5) combined with unmutated IgVH confers the worst prognosis (n = 14, red color), while low microarray score (< 0.5) combined with mutated IgVH confer the best prognosis (n = 22, blue color). Low microarray score with unmuated IgVH (n = 9, light blue color) or high microarray score with mutated IgVH (n = 13, pink color) confer intermediate prognoses. P values were calculated using the log-rank test. Panel D: Kaplan-Meier analysis of freedom from therapy in patients from the Spanish National Cancer Centre predicted to have stable disease (prediction score < 0.5, n = 87, blue color) compared to patients predicted to have progressive disease (prediction score ≥ 0.5, n = 73, red color). Panel E: Kaplan-Meier analysis of freedom from therapy in patients from the National Cancer Institute predicted to have stable disease (prediction score < 0.5, n = 58, blue color) compared to patients predicted to have progressive disease (prediction score ≥ 0.5, n = 49, red color). Panel F: Combination of IgVH mutational status with genomic prediction of progressive disease reveals improved prognostic capabilities in the National Cancer Institute cohort. Low microarray score (< 0.5) combined with mutated IgVH confer the best prognosis (n = 44, blue color) conferred the best prognosis. High microarray score (≥ 0.5) combined with unmutated IgVH (n = 14, red color), low microarray score with unmuated IgVH (n = 14, pink color) and high microarray score with mutated IgVH (n = 35, light blue color) are also displayed. P values were calculated using the log-rank test.
Figure 3
Figure 3. Genomic Signatures of Chemotherapy Sensitivity Applied to Clinical Data
Panel A: The top figure demonstrates the heatmap of the 140-gene signature of resistance to chlorambucil, created from gene expression profiling of cell lines sensitive and resistant to this agent. Red color represents upregulated genes while blue color represents downregulated genes. The middle figure displays the leave-one-out cross validation values for the training data set. The horizontal lines represent median predicted values for the sensitive and resistant groups, 0.025 and 0.969 respectively. As seen in the bottom figure, when applied to genomic data of CLL cells from patients subsequently treated with chlorambucil, this signature can discriminate patients based on clinical response to therapy, with blue color denoting a prediction of more durable response (prediction score < 0.5, n = 8) and red color denoting a prediction of less durable response (prediction score ≥ 0.5, n = 6). P-value determined by log-rank test. Panel B: The top figure demonstrates the heatmap of the 60-gene signature of resistance to pentostatin, cyclophosphamide, and rituximab (PCR), created from genomic data from patients who progressed early or were long-term responders. Red color represents upregulated genes while blue color represents downregulated genes. The middle figure displays the leave-one-out cross validation values for the training data set. The horizontal lines represent median predicted values for the long-term responder and early progressor groups, 0.329 and 0.822 respectively. As seen in the bottom figure, when applied to the genomic data from an additional 20 patients treated with this regimen and using a cut-off of 0.5, this signature can separate patients based on response, with blue color denoting a prediction of long-term response (n = 15) and red color denoting a prediction of early progression (n = 5). P-value determined by log-rank test.

References

    1. Crespo M, Bosch F, Villamor N, et al. ZAP-70 expression as a surrogate for immunoglobulin-variable-region mutations in chronic lymphocytic leukemia. N Engl J Med. 2003;348:1764–1775. - PubMed
    1. Damle RN, Wasil T, Fais F, et al. Ig V gene mutation status and CD38 expression as novel prognostic indicators in chronic lymphocytic leukemia. Blood. 1999;94:1840–1847. - PubMed
    1. Dohner H, Stilgenbauer S, Benner A, et al. Genomic aberrations and survival in chronic lymphocytic leukemia. N Engl J Med. 2000;343:1910–1916. - PubMed
    1. Hallek M, Wanders L, Ostwald M, et al. Serum beta(2)-microglobulin and serum thymidine kinase are independent predictors of progression-free survival in chronic lymphocytic leukemia and immunocytoma. Leuk Lymphoma. 1996;22:439–447. - PubMed
    1. Rassenti LZ, Huynh L, Toy TL, et al. ZAP-70 compared with immunoglobulin heavy-chain gene mutation status as a predictor of disease progression in chronic lymphocytic leukemia. N Engl J Med. 2004;351:893–901. - PubMed

Publication types

MeSH terms