

Differential pharmacodynamic effects of paclitaxel formulations in an intracranial rat brain tumor model
- PMID: 19861574
- PMCID: PMC2812113
- DOI: 10.1124/jpet.109.160044
Differential pharmacodynamic effects of paclitaxel formulations in an intracranial rat brain tumor model
Abstract
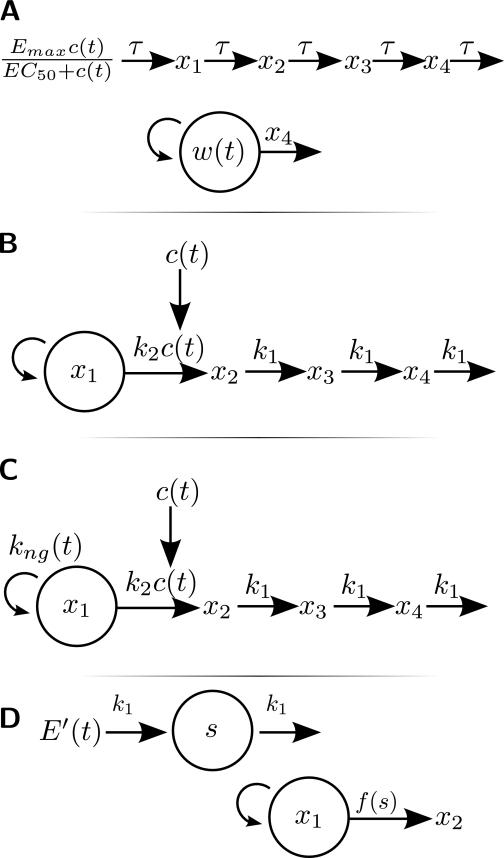
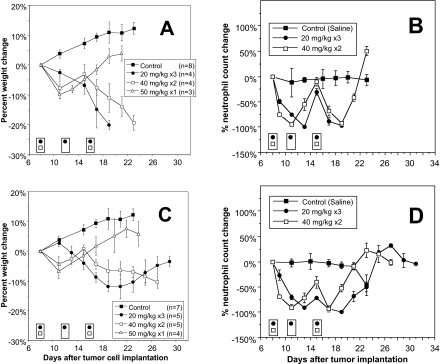
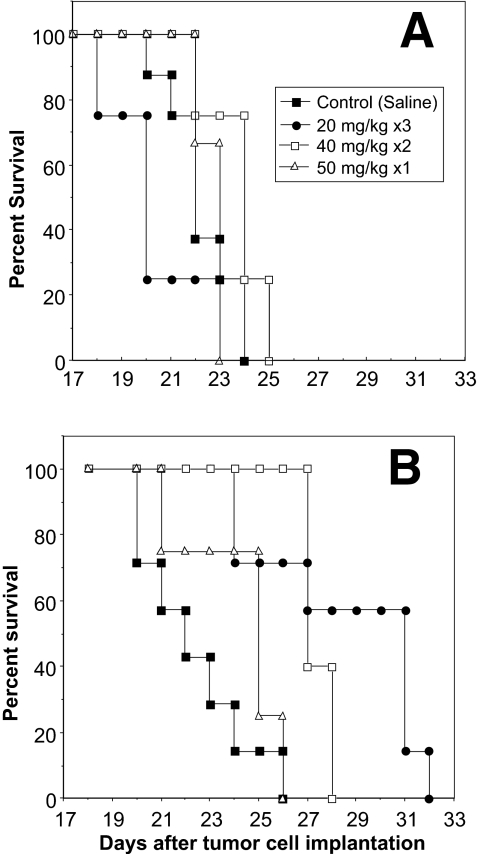
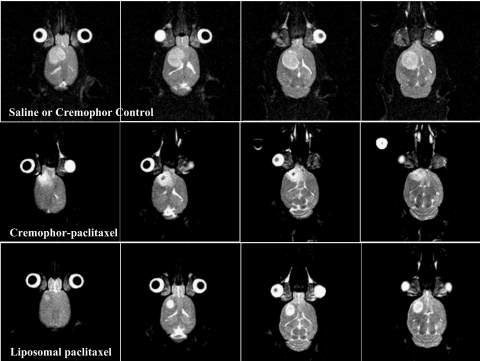
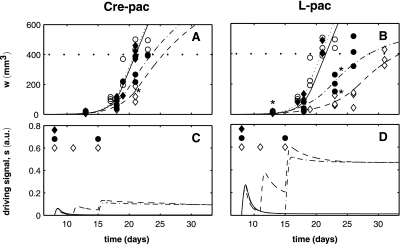
Nano- and microparticulate carriers can exert a beneficial impact on the pharmacodynamics of anticancer agents. To investigate the relationships between carrier and antitumor pharmacodynamics, paclitaxel incorporated in liposomes (L-pac) was compared with the clinical standard formulated in Cremophor-EL/ethanol (Cre-pac) in a rat model of advanced primary brain cancer. Three maximum-tolerated-dose regimens given by intravenous administration were investigated: 50 mg/kg on day 8 (d8) after implantation of 9L gliosarcoma tumors; 40 mg/kg on d8 and d15; 20 mg/kg on d8, d11, and d15. Body weight change and neutropenia were assessed as pharmacodynamic markers of toxicity. The pharmacodynamic markers of antitumor efficacy were increase in lifespan (ILS) and tumor volume progression, measured noninvasively by magnetic resonance imaging. At equivalent doses, neutropenia was similar for both formulations, but weight loss was more severe for Cre-pac. No regimen of Cre-pac extended survival, whereas L-pac at 40 mg/kg x2 doses was well tolerated and mediated 26% ILS (p < 0.0002) compared with controls. L-pac at a lower cumulative dose (20 mg/kg x3) was even more effective (40% ILS; p < 0.0001). In striking contrast, the identical regimen of Cre-pac was lethal. Development of a novel semimechanistic pharmacodynamic model permitted quantitative hypothesis testing with the tumor volume progression data, and suggested the existence of a transient treatment effect that was consistent with sensitization or "priming" of tumors by more frequent L-pac dosing schedules. Therefore, improved antitumor responses of carrier-based paclitaxel formulations can arise both from dose escalation, because of reduced toxicity, and from novel carrier-mediated alterations of antitumor pharmacodynamic effects.
Figures
Similar articles
-
Meta-analysis of nanoparticulate paclitaxel delivery system pharmacokinetics and model prediction of associated neutropenia.Pharm Res. 2012 Oct;29(10):2833-44. doi: 10.1007/s11095-012-0775-8. Epub 2012 May 17. Pharm Res. 2012. PMID: 22588463
-
Pharmacokinetics of paclitaxel-containing liposomes in rats.AAPS PharmSci. 2003 Nov 21;5(4):E32. doi: 10.1208/ps050432. AAPS PharmSci. 2003. PMID: 15198520 Free PMC article.
-
Pharmacodynamics of non-break weekly paclitaxel (Taxol) and pharmacokinetics of Cremophor-EL vehicle: results of a dose-escalation study.Anticancer Drugs. 2002 Jun;13(5):481-9. doi: 10.1097/00001813-200206000-00006. Anticancer Drugs. 2002. PMID: 12045459
-
Alternative formulations of paclitaxel.Cancer Treat Rev. 1997 Mar;23(2):87-95. doi: 10.1016/s0305-7372(97)90022-0. Cancer Treat Rev. 1997. PMID: 9225960 Review.
-
Albumin-bound paclitaxel: a next-generation taxane.Expert Opin Pharmacother. 2006 Jun;7(8):1041-53. doi: 10.1517/14656566.7.8.1041. Expert Opin Pharmacother. 2006. PMID: 16722814 Review.
Cited by
-
Cationic Liposomes as Vectors for Nucleic Acid and Hydrophobic Drug Therapeutics.Pharmaceutics. 2021 Aug 30;13(9):1365. doi: 10.3390/pharmaceutics13091365. Pharmaceutics. 2021. PMID: 34575441 Free PMC article. Review.
-
Precision targeting of the CNS: recent progress in brain-directed nanodrug delivery.RSC Adv. 2025 Jul 21;15(32):25910-25928. doi: 10.1039/d5ra03578c. eCollection 2025 Jul 21. RSC Adv. 2025. PMID: 40697447 Free PMC article. Review.
-
Distinct solubility and cytotoxicity regimes of paclitaxel-loaded cationic liposomes at low and high drug content revealed by kinetic phase behavior and cancer cell viability studies.Biomaterials. 2017 Nov;145:242-255. doi: 10.1016/j.biomaterials.2017.08.026. Epub 2017 Aug 17. Biomaterials. 2017. PMID: 28889081 Free PMC article.
-
Different ODE models of tumor growth can deliver similar results.BMC Cancer. 2020 Mar 17;20(1):226. doi: 10.1186/s12885-020-6703-0. BMC Cancer. 2020. PMID: 32183732 Free PMC article.
-
Modified carbazoles destabilize microtubules and kill glioblastoma multiform cells.Eur J Med Chem. 2018 Nov 5;159:74-89. doi: 10.1016/j.ejmech.2018.09.026. Epub 2018 Sep 11. Eur J Med Chem. 2018. PMID: 30268825 Free PMC article.
References
-
- Belotti D, Vergani V, Drudis T, Borsotti P, Pitelli MR, Viale G, Giavazzi R, Taraboletti G. (1996) The microtubule-affecting drug paclitaxel has antiangiogenic activity. Clin Cancer Res 2:1843–1849 - PubMed
-
- Blagosklonny MV, Fojo T. (1999) Molecular effects of paclitaxel: myths and reality (a critical review). Int J Cancer 83:151–156 - PubMed
-
- Bocci G, Nicolaou KC, Kerbel RS. (2002) Protracted low-dose effects on human endothelial cell proliferation and survival in vitro reveal a selective antiangiogenic window for various chemotherapeutic drugs. Cancer Res 62:6938–6943 - PubMed
-
- Bulitta JB, Zhao P, Arnold RD, Kessler DR, Daifuku R, Pratt J, Luciano G, Hanauske AR, Gelderblom H, Awada A, et al. (2009a) Mechanistic population pharmacokinetics of total and unbound paclitaxel for a new nanodroplet formulation versus Taxol in cancer patients. Cancer Chemother Pharmacol 63:1049–1063 - PubMed
Publication types
MeSH terms
Substances
Grants and funding
LinkOut - more resources
Full Text Sources
Other Literature Sources
Medical
