. 2009 Oct 27;2(94):ra69.
doi: 10.1126/scisignal.2000442.

Increased MKK4 abundance with replicative senescence is linked to the joint reduction of multiple microRNAs

Affiliations

Increased MKK4 abundance with replicative senescence is linked to the joint reduction of multiple microRNAs

Bernard S Marasa et al. Sci Signal. .

Abstract

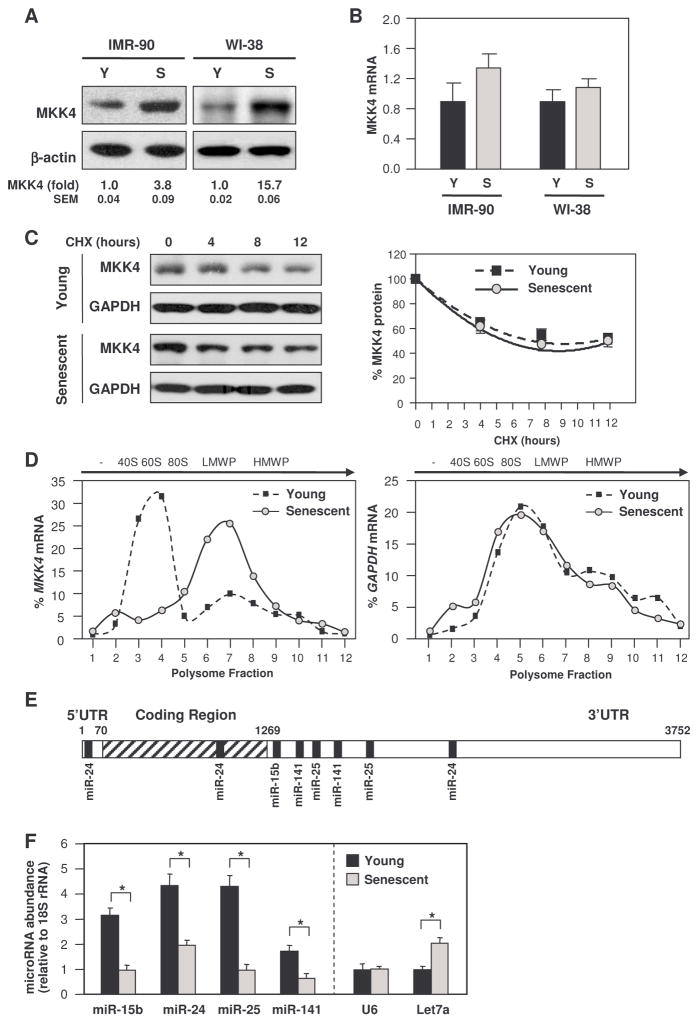
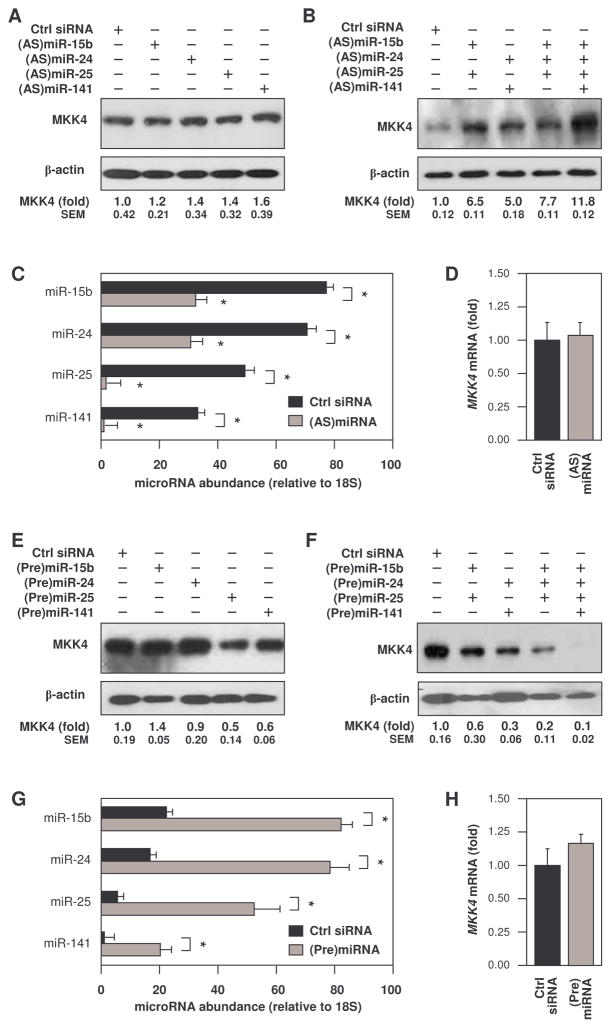
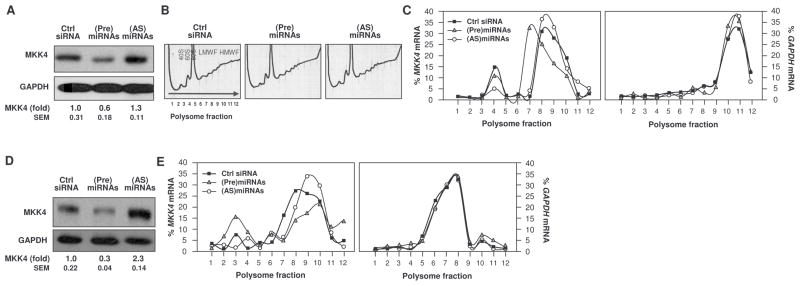
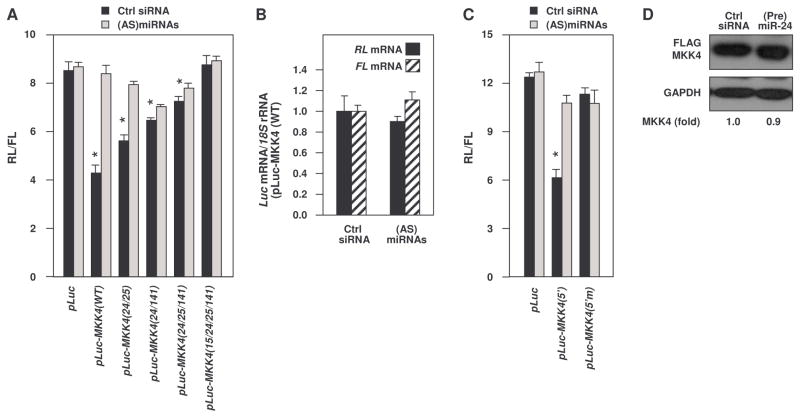
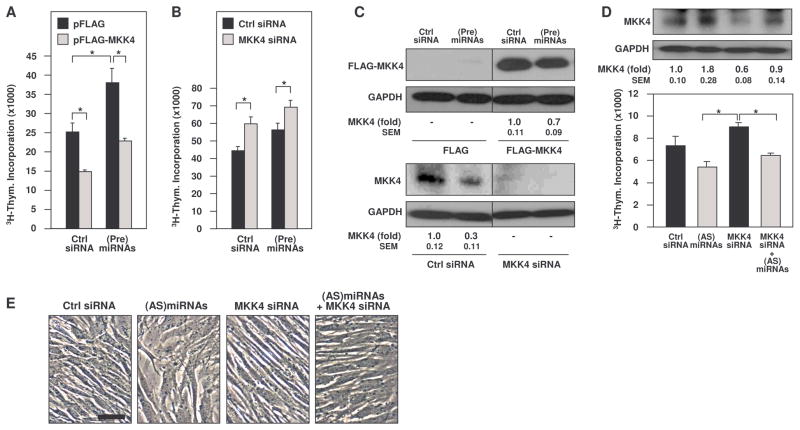
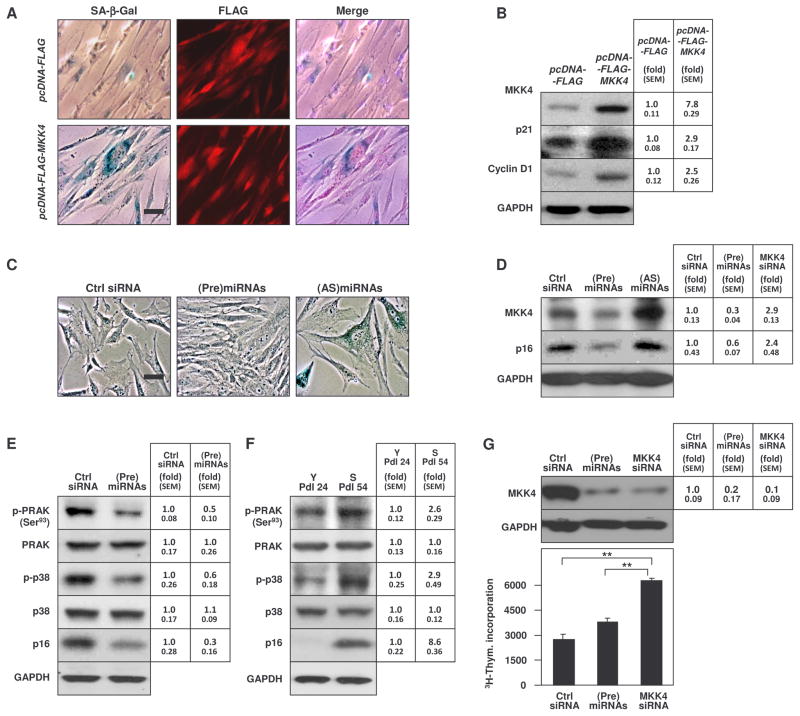
MKK4 (mitogen-activated protein kinase kinase 4) is a pivotal upstream activator of c-Jun N-terminal kinase and p38. Here, we report that the abundance of MKK4 increases in senescent human diploid fibroblasts through enhanced translation. We identified four microRNAs (miR-15b, miR-24, miR-25, and miR-141) that target the MKK4 messenger RNA (mRNA); the abundance of these microRNAs decreased during replicative senescence. Individually modulating the amount of each microRNA did not modify MKK4 abundance, but their concomitant overexpression decreased and their joint reduction increased MKK4 abundance. Reporter analyses indicated that these microRNAs acted through the MKK4 5' and 3' untranslated regions. Elevated MKK4 abundance inhibited cell proliferation and increased the phosphorylation and activity of p38 and PRAK (p38-regulated/activated protein kinase). Thus, multiple microRNAs acting on a single target, the MKK4 mRNA, collectively influence MKK4 abundance during replicative senescence.


Figures

Fig. 1
Fig. 1. Senescent human diploid fibroblasts (HDFs) show elevated MKK4 and reduced MKK4-directed miRNAs
(A) Representative Western blot analysis of MKK4 abundance in young (Y, Pdl 11) and senescent (S, Pdl 51) IMR-90 fibroblasts, as well as in young (Pdl 24) and senescent (Pdl 54) WI-38 fibroblasts. β-actin was included as loading control. MKK4 signals from at least three Western blots were quantified by densitometry and normalized to β-actin signals. (B) MKK4 mRNA, as measured by RT-qPCR analysis of total RNA isolated from IMR-90 and WI-38 fibroblasts. (C) MKK4 protein stability was determined in young (Pdl 24) and senescent (Pdl 54) WI-38 cells that had been treated with cycloheximide (CHX, 50 μg/ml) and immunoblotting for MKK4 and GAPDH as a loading control. (D) Association of MKK4 mRNA (and GAPDH mRNA as a control) with cellular polysomes. After centrifugation of cytoplasmic components through linear 10–50% sucrose gradients, mRNA amounts in each fraction were measured by RT-qPCR and plotted as a percentage of the total mRNA in the sample. Arrow, direction of sedimentation; -, fractions lacking ribosome components; 40S and 60S, small and large ribosomal subunits, respectively; 80S, monosome; LMWP and HMWP, low- and high-molecular weight polysomes, respectively. (E) Schematic of the MKK4 mRNA, including the predicted target sites for miR-15b, miR-24, miR-25, and miR-141. (F) miR-15b, miR-24, miR-25, and miR-141 in young (Pdl 24) and senescent (Pdl 54) WI-38 cells were quantified by RT-qPCR analysis, normalized to 18S rRNA. As controls, U6 (which was unchanged between young and senescent cells) and let7a miRNA (which was elevated in senescent cells) were also measured. Data represent standard error of the mean (SEM) from 3 independent experiments; *, p<0.05, paired t test.
Fig. 2
Fig. 2. miRNAs directed against MKK4 cooperatively reduce MKK4 protein abundance
(A to D) Young WI-38 cells were transfected with control (Ctrl) siRNA or with different combinations of antisense (AS)miRNAs (100 nM final). 48 hours later, the individual (A) or combined (B) effects of the (AS)miRNAs on MKK4 abundance was determined by Western blot analysis, using β-actin as a loading control. RT-qPCR was used to quantify each miRNA individually (C) as well as MKK4 mRNA in young WI-38 cells transfected with control siRNA or with all four (AS)miRNAs, using 18S rRNA for normalization (D). (E to H) Senescent WI-38 cells were transfected with either control (Ctrl) siRNA or with different combinations of precursor (Pre)miRNAs (100 nM final). The individual (E) or combined (F) effect of the (Pre)miRNAs on MKK4 abundance was determined by Western blot analysis, using β-actin as a loading control. RT-qPCR was used to quantify each miRNA (G), and MKK4 mRNA in S WI-38 cells transfected with Ctrl siRNA or all four (Pre)miRNAs, using 18S rRNA for normalization (H). MKK4 signals were quantified by densitometry from 3 independent Western blots (A, B, E, and F). Data are shown as SEM from 3 independent experiments (C, D, G, and H); *, p<0.05, paired t test..
Fig. 3
Fig. 3. miRNAs directed against MKK4 cooperatively repress MKK4 association with polysomes
(A) HeLa cells were transfected with Ctrl siRNA, with four pooled (Pre)miRNAs [ (Pre)miR-15b, (Pre)miR-24, (Pre)miR-25, and (Pre)miR-141] or with four pooled (AS)miRNAs [(AS)miR-15b, (AS)miR-24, (AS)miR-25, and (AS)miR-141]. 48 hours later, MKK4 and GAPDH as a loading control were assessed by Western blot analysis. (B) Analysis of polysome profiles in cells transfected as described in (A). (C) Distribution of the mRNAs for MKK4 (left) and GAPDH (right) on polysome gradients prepared from the transfection groups described in panel A. (D and E) WI-38 cells of intermediate passage (Pdl 39) were transfected as described in (A). 48 hours later, MKK4 was assessed by Western blot analysis (D) and MKK4 mRNA distribution on polysome gradients was determined (E). MKK4 signals were quantified by densitometry from 3 Western blots (A and D).
Fig. 4
Fig. 4. MKK4 reporter analysis
(A) psiCHECK-2-derived reporter constructs used are shown in fig. S7. pLuc, control vector expressing Renilla luciferase (RL) and firefly luciferase (FL). pLuc-MKK4(WT) is a fusion of RL and the 1.3 kb proximal MKK4 3′UTR segment bearing all six predicted miRNA sites. pLuc-MKK4(24/25) was derived from pLuc-MKK4(WT) by introducing mutations in the seed regions of miR-24 and miR-25 sites. In pLuc-MKK4(24/141), the mutations were introduced in miR-24 and miR-141 sites. In pLuc-MKK4(24/25/141), the mutations were introduced in miR-24, miR-25, and miR-141 sites. In pLuc-MKK4(15b/24/25/141), all six miRNA sites on the MKK4 3′ UTR were mutated (fig. S6). WI-38 cells that were transfected with either control siRNA or pooled (AS)miRNAs were subsequently transfected with reporter plasmids (fig. S7), and RL activity and FL activity were measured 24 hours later. RL/FL values are shown. (B) RL and FL mRNAs were measured in WI-38 cells (with normal or reduced amounts of miRNAs) by RT-qPCR analysis 24 hours after transfection of pLuc-MKK4(WT). (C) Cells were transfected with pLuc, pLuc-MKK4(5) (which expresses an RL chimeric RNA with the wild-type MKK4 5′UTR), and pLuc-MKK4(5m) (which expresses an RL chimeric RNA with the mutated MKK4 5′UTR (fig. S7). 24 hours later, RL and FL activities were measured. (D) The plasmid pcDNA-FLAG-MKK4 and the miR-24 site within the MKK4 coding region are shown in fig. S7. WI-38 cells were cotransfected with either control siRNA or (Pre)miR-24 along with pFLAG-MKK4. 24 hours later, MKK4 was quantified by Western blot and densitometry analysis of the FLAG signals. Data are representative of 3 experiments. Data represent SEM from 3 independent experiments (A, B, and C). *, p < 0.05. Statistical significance was determined by ANOVA followed by Tukey multiple comparisons test.
Fig. 5
Fig. 5. MKK4 reduces proliferation
(A to C) 3H-thymidine incorporation was measured 48 hours after cotransfection of HeLa cells with control siRNA or Pre(miRNAs) and (A) pFLAG or pFLAG-MKK4 plasmids or (B) control or MKK4 siRNA. The abundance of MKK4, FLAG-MKK4, and the loading control GAPDH was determined by Western blot analysis and densitometry (C). (D) Quantification of MKK4 by Western blot analysis and densitometry (top) and 3H-thymidine incorporation (graph) 48 hours after transfection of WI-38 cells of intermediate Pdl (Pdl 39) with the small RNAs shown. (E) Phase-contrast micrographs of cells from the transfection groups described in (D). Scale bars, 50 μm (A and E). Data represent SEM from 3 independent experiments (A, B, and D). Western blots are representative of 3 independent experiments (C and D). *, p<0.05. Statistical significance was determined by ANOVA followed by Tukey multiple comparisons test.
Fig. 6
Fig. 6. Altering MKK4 abundance changes markers of replicative senescence
(A and B) 48 hours after transfection of young WI-38 cells with pcDNA-FLAG or pcDNA-FLAG-MKK4, SA-β-gal activity and FLAG signals were detected by phase-contrast microscopy and fluorescence microscopy, respectively (A). The abundance of MKK4, the loading control GAPDH, and the senescence-associated proteins p21 and cyclin D1 was assessed by Western blot analysis (B). (C) Young WI-38 cells (Pdl 24) were sequentially transfected (every 4 days for 5 weeks) with the small RNAs indicated. Cellular morphology and SA-β-gal activity were assessed by phase-contrast microscopy. Images are representative of N=2 independent experiments. (D) Western blot analysis of the abundance of MKK4, the senescence marker p16, and the loading control GAPDH in the populations described in panel C. (E and F) Western blot analysis of total PRAK and phosphorylated PRAK (p-PRAK), total and phosphorylated p38 (p-p38), p16, and the loading control GAPDH, as assessed 48 hours after transfection of WI-38 cells (Pdl 39) with control siRNA or (Pre)miRNAs. Protein abundance was also assessed in untransfected young (Pdl 24) and senescent (Pdl 54) WI-38 cells. (G) MKK4 was quantified by Western blot analysis and densitometry (top) and 3H-thymidine incorporation (graph) in S WI-38 (Pdl 54) cells 48 hours after transfection of the small RNAs shown. Data are shown as SEM. The signals in 3 independent Western blot analyses were quantified by densitometry (B, D, E, F, and G). **, p<0.001. Statistical significance was determined by ANOVA followed by Tukey multiple comparisons test.

Comment in

References

    1. Hayflick L. The limited in vitro lifetime of human diploid cell strains. Exp Cell Res. 1965;37:614–636. - PubMed
    1. Cristofalo VJ, Lorenzini A, Allen RG, Torres C, Tresini M. Replicative senescence: a critical review. Mech Ageing Dev. 2004;125:827–848. - PubMed
    1. Smith JR, Pereira-Smith OM. Replicative senescence: implications for in vivo aging and tumor suppression. Science. 1996;273:63–67. - PubMed
    1. Campisi J. Senescent cells, tumor suppression, and organismal aging: good citizens, bad neighbors. Cell. 2005;120:513–522. - PubMed
    1. Abdelmohsen K, Kuwano Y, Kim HH, Gorospe M. Posttranscriptional gene regulation by RNA-binding proteins during oxidative stress: implications for cellular senescence. Biol Chem. 2008;389:243–255. - PMC - PubMed