

Success in developing regions: world records evolution through a geopolitical prism
- PMID: 19862324
- PMCID: PMC2763220
- DOI: 10.1371/journal.pone.0007573
Success in developing regions: world records evolution through a geopolitical prism
Abstract
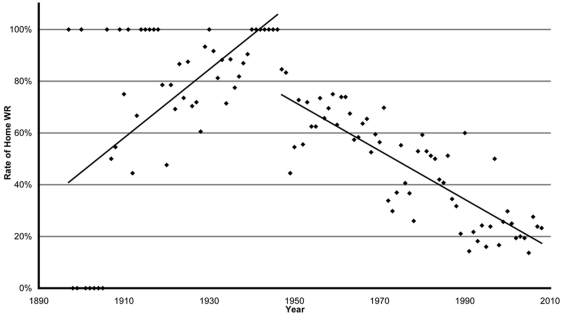
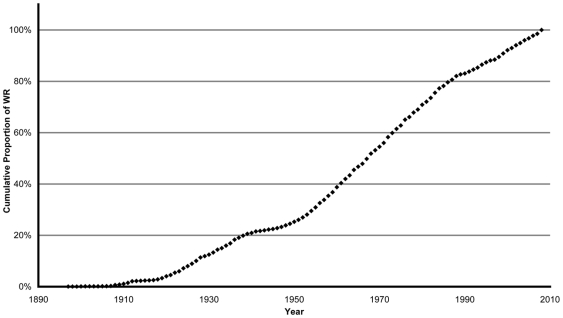
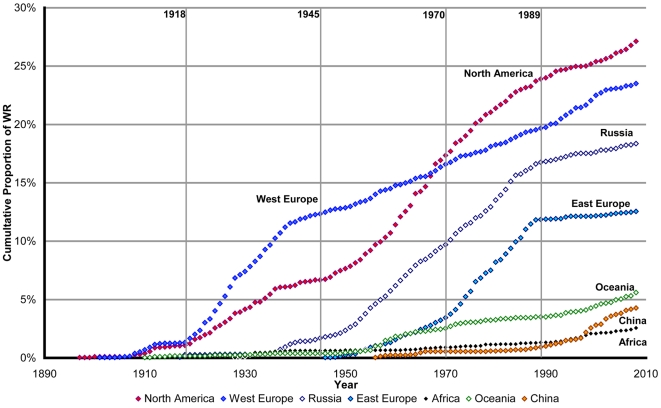
A previous analysis of World Records (WR) has revealed the potential limits of human physiology through athletes' personal commitment. The impact of political factors on sports has only been studied through Olympic medals and results. Here we studied 2876 WR from 63 nations in four summer disciplines. We propose three new indicators and show the impact of historical, geographical and economical factors on the regional WR evolution. The south-eastward path of weighted annual barycenter (i.e. the average of country coordinates weighting by the WR number) shows the emergence of East Africa and China in WR archives. Home WR ratio decreased from 79.9% before the second World War to 23.3% in 2008, underlining sports globalization. Annual Cumulative Proportions (ACP, i.e. the cumulative sum of the WR annual rate) highlight the regional rates of progression. For all regions, the mean slope of ACP during the Olympic era is 0.0101, with a maximum between 1950 and 1989 (0.0156). For European countries, this indicator reflects major historical events (slowdown for western countries after 1945, slowdown for eastern countries after 1990). Mean North-American ACP slope is 0.0029 over the century with an acceleration between 1950 and 1989 at 0.0046. Russia takes off in 1935 and slows down in 1988 (0.0038). For Eastern Europe, maximal progression is seen between 1970 and 1989 (0.0045). China starts in 1979 with a maximum between 1990 and 2008 (0.0021), while other regions have largely declined (mean ACP slope for all other countries = 0.0011). A similar trend is observed for the evolution of the 10 best performers. The national analysis of WR reveals a precise and quantifiable link between the sport performances of a country, its historical or geopolitical context, and its steps of development.
Conflict of interest statement
Figures
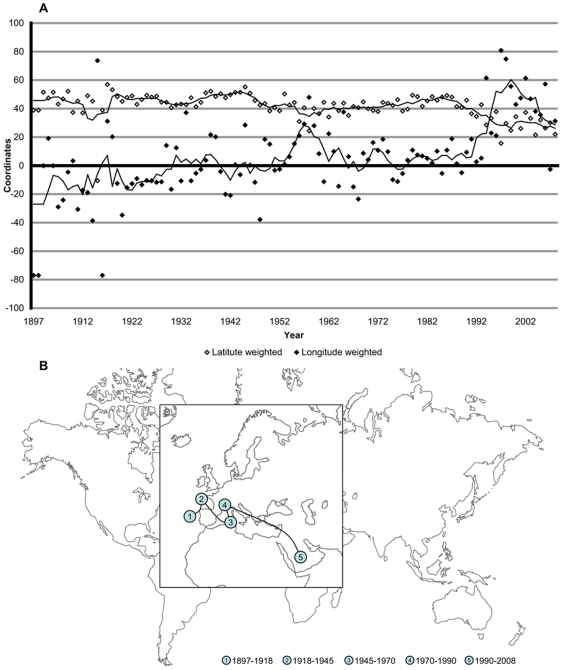
 (42°31′, 14°31′),
  (47°26′, 2°53′),
  (41°13′, 7°15′),
  (44°01′, 5°09′),
  (31°10′, 37°17′), respectively (latitude, longitude).
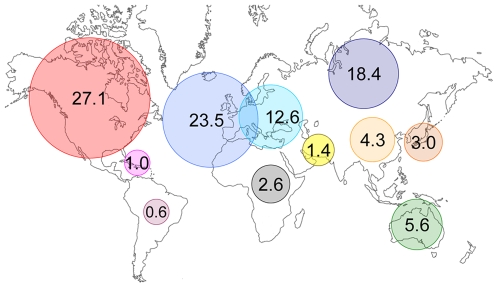
References
-
- Berthelot G, Thibault V, Tafflet M, Escolano S, El Helou N, et al. The Citius End: World Records Progression Announces the Completion of a Brief Ultra-Physiological Quest. PLoS ONE. 2008;3(2):e1552.. doi: 10.1371/journal.pone.0001552. - DOI - PMC - PubMed
-
- Desgorces FD, Berthelot G, El Helou N, Thibault V, Guillaume M, et al. From Oxford to Hawaii: Ecophysiological barriers limit human progression in ten sport monuments. PLoS ONE. 2008;3(11):e3653. doi: 10.1371/journal.pone.0003653. - DOI - PMC - PubMed
-
- Bernard AB, Busse MR. Who Wins the Olympic Games: Economic Resources and Medal Totals. Rev Econ Stat. 2004;86(1):413–417.
-
- Andreff W, Andreff M, Poupaux S. Les déterminants économiques de la performance Olympique : prévision du nombre de médailles gagnées aux Jeux de Pékin. Revue d'Economie Politique. 2008;118(2):135–169. doi: REDP.182.0135.
-
- International Olympic Committee (IOC) official website. http://www.olympic.org.
Publication types
MeSH terms
LinkOut - more resources
Full Text Sources
Molecular Biology Databases
