Comparative Study
. 2010 Jan;38(2):e8.
doi: 10.1093/nar/gkp901. Epub 2009 Oct 28.

Measurement of replication structures at the nanometer scale using super-resolution light microscopy

Affiliations
Comparative Study

Measurement of replication structures at the nanometer scale using super-resolution light microscopy

D Baddeley et al. Nucleic Acids Res. 2010 Jan.

Abstract

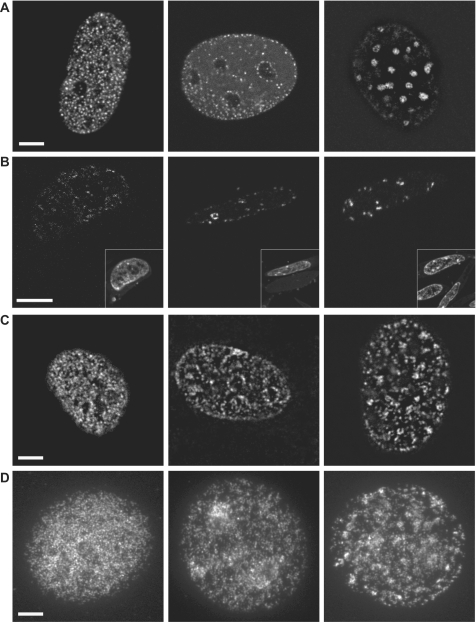
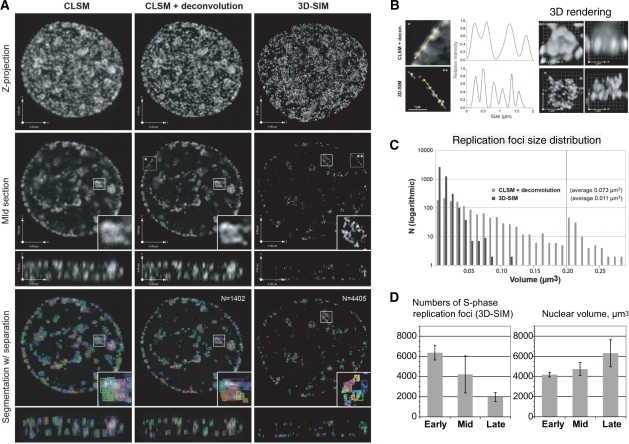
DNA replication, similar to other cellular processes, occurs within dynamic macromolecular structures. Any comprehensive understanding ultimately requires quantitative data to establish and test models of genome duplication. We used two different super-resolution light microscopy techniques to directly measure and compare the size and numbers of replication foci in mammalian cells. This analysis showed that replication foci vary in size from 210 nm down to 40 nm. Remarkably, spatially modulated illumination (SMI) and 3D-structured illumination microscopy (3D-SIM) both showed an average size of 125 nm that was conserved throughout S-phase and independent of the labeling method, suggesting a basic unit of genome duplication. Interestingly, the improved optical 3D resolution identified 3- to 5-fold more distinct replication foci than previously reported. These results show that optical nanoscopy techniques enable accurate measurements of cellular structures at a level previously achieved only by electron microscopy and highlight the possibility of high-throughput, multispectral 3D analyses.


Figures

Figure 1.
Figure 1.
Characteristic RF patterns in mammalian cells and effect of various treatments. (A) The three main patterns of RF that appear in course of S-phase are presented. From left to right: early, middle and late S-phase. Representative confocal optical sections of RF in untreated live GFP–PCNA expressing mouse cells. (B) Appearance of the same S-phase patterns in cryosections is presented. The reduced amount of visible GFP–PCNA RF is due to the fact that thickness of the cryosections (100–200 nm) is several times smaller than z-axis optical resolution at 520 nm (GFP). Inserts show images of the same cell stained with DAPI before making the sections. (C) BrdU-labeled (10 min), formaldehyde-fixed cells were immunostained with anti-BrdU antibody and mounted in Mowiol. The fixation/mounting of the cells provided for the decrease in nuclei thickness and hence for poorer resolution of RF. (D) Cells labeled 10 min with BrdU were trypsinized and the cells in suspension were treated with the hypotonic solution and fixed with methanol:acetic acid mixture followed by immunostaining with anti-BrdU antibody and mounting in Vectashield. Scale bars = 5 µm.
Figure 2.
Figure 2.
SMI imaging of RF. After acquisition of the raw data (A), a filtering and thresholding procedure was used to identify the positions of individual foci. Once the positions of the foci have been established (blue boxed area shown in greater detail in B), a model function is fitted at the location of each focus to extract the object size and a more accurate position estimate. The results of this fitting procedure were visualized by rendering a sphere at each object position, which was colored according to the object size. This resulted in the 3D representation shown in (C). Objects that could not be fitted, due to either insufficient signal level or a size outside the effective range (∼40–200 nm) for SMI measurements were colored black. Scale bar = 5μm. As well as a size estimate, the fitting procedure delivered the 3D positions of the foci. The flatness of the resulting preparations could thus be measured using these 3D positions. The 3D representation (C) was rotated by 90° to obtain a side on view (D) showing the vertical extent of the cell. The axial spread in the centers of the foci was measured to be ∼160 ± 70 nm. Note that the tilt in the cell resulted from a small misalignment in the experimental setup. This alignment error did not otherwise affect the operation of the microscope.
Figure 3.
Figure 3.
SMI measurement of RF size. (A) The application of the data analysis scheme results in a size distribution for each cell. Shown here are typical examples from each of the three different preparation methods used in our experiments. From left to right are: a hypotonic specimen labeled using BrdU incorporation and antibody staining, a cryosection labeled using GFP–PCNA and a GFP–PCNA specimen with subsequent anti-GFP antibody amplification. The size distribution obtained is shown below the corresponding cell. The distribution for the BrdU foci is, in addition, separated according to the contribution of each intensity threshold level to the total distribution. The brightest objects are red and the weakest blue. Scale bars = 5 μm. (B) Summary of the collected results for all cells in each preparation method categorized according to S-phase stage. From left to right are the BrdU-labeled hypotonic preparation, GFP–PCNA cryosections and GFP–PCNA cryosections with antibody amplification. From top to bottom are a line histogram, cumulative histogram and box-and-whisker plot. The cumulative histogram represents the integral of the distribution, and avoids the binning effects present in a normal histogram.
Figure 4.
Figure 4.
3D-SIM super-resolution imaging and counting of RF numbers. (A) Mouse C2C12 cells were BrdU pulse labeled (30 min) and sites of BrdU incorporation were visualized using BrdU-specific antibodies after DNase I denaturation. Nuclei with replication pattern typical for mid–late S-phase are shown. To improve signal-to-noise ratio a constrained iterative deconvolution was applied to the confocal (CLSM) image stack using a maximum-likelihood estimation algorithm (column 2). Large RF at chromocenters consisted of ∼100–120-nm-sized subdomains that could only be resolved with 3D-SIM (insets in second row), which leads to dramatic increase in apparent RF numbers. To determine numbers and volumes of RF a threshold-based segmentation was applied combined with an object separation routine (third row). (B) Intensity plot profile yielded about 2-fold smaller peak width (FWHM) of RF recorded with 3D-SIM compared to deconvolved confocal images. 3D volume rendering of a replicating chromocenter demonstrated the increased resolution in x, y and z-direction with 3D-SIM. (C) The segmented foci (CLSM + deconvolution n ∼ 1400; 3D-SIM n ∼ 4400) were characterized by lower size heterogeneity and about 7-fold smaller average volume in accordance with the 2-fold better xyz resolution of 3D-SIM. (D) Quantitative analysis of the RF segmented in the 3D-SIM data sets gave 3- to 5-fold higher RF numbers that have been previously detected (see also RF numbers detected in the deconvolved CLSM image stack in A and Table 2). The RF numbers decreased from early to late S-phase cells.

References

    1. Leonhardt H, Rahn HP, Weinzierl P, Sporbert A, Cremer T, Zink D, Cardoso MC. Dynamics of DNA replication factories in living cells. J. Cell Biol. 2000;149:271–280. - PMC - PubMed
    1. Somanathan S, Suchyna T, Siegel A, Berezney R. Targeting of PCNA to sites of DNA replication in the mammalian cell nucleus. J. Cell Biochem. 2001;81:56–67. - PubMed
    1. Sadoni N, Cardoso MC, Stelzer EH, Leonhardt H, Zink D. Stable chromosomal units determine the spatial and temporal organization of DNA replication. J. Cell Sci. 2004;117:5353–5365. - PubMed
    1. Nakamura H, Morita T, Sato C. Structural organizations of replicon domains during DNA synthetic phase in the mammalian nucleus. Exp. Cell Res. 1986;165:291–297. - PubMed
    1. Aten JA, Bakker PJ, Stap J, Boschman GA, Veenhof CH. DNA double labelling with IdUrd and CldUrd for spatial and temporal analysis of cell proliferation and DNA replication. Histochem. J. 1992;24:251–259. - PubMed

Publication types

Substances