. 2010 Jan;103(1):192-205.
doi: 10.1152/jn.00624.2009. Epub 2009 Oct 28.

Laminar diversity of dynamic sound processing in cat primary auditory cortex

Affiliations

Laminar diversity of dynamic sound processing in cat primary auditory cortex

Craig A Atencio et al. J Neurophysiol. 2010 Jan.

Abstract

For primary auditory cortex (AI) laminae, there is little evidence of functional specificity despite clearly expressed cellular and connectional differences. Natural sounds are dominated by dynamic temporal and spectral modulations and we used these properties to evaluate local functional differences or constancies across laminae. To examine the layer-specific processing of acoustic modulation information, we simultaneously recorded from multiple AI laminae in the anesthetized cat. Neurons were challenged with dynamic moving ripple stimuli and we subsequently computed spectrotemporal receptive fields (STRFs). From the STRFs, temporal and spectral modulation transfer functions (tMTFs, sMTFs) were calculated and compared across layers. Temporal and spectral modulation properties often differed between layers. On average, layer II/III and VI neurons responded to lower temporal modulations than those in layer IV. tMTFs were mainly band-pass in granular layer IV and became more low-pass in infragranular layers. Compared with layer IV, spectral MTFs were broader and their upper cutoff frequencies higher in layers V and VI. In individual penetrations, temporal modulation preference was similar across layers for roughly 70% of the penetrations, suggesting a common, columnar functional characteristic. By contrast, only about 30% of penetrations showed consistent spectral modulation preferences across layers, indicative of functional laminar diversity or specialization. Since local laminar differences in stimulus preference do not always parallel the main flow of information in the columnar cortical microcircuit, this indicates the influence of additional horizontal or thalamocortical inputs. AI layers that express differing modulation properties may serve distinct roles in the extraction of dynamic sound information, with the differing information specific to the targeted stations of each layer.


Figures

Fig. 1.
Fig. 1.
Example penetration site. A: schematic of linear Michigan recording probe. B: Nissl section of primary auditory cortex (AI), showing electrode track and 2 electrolytic lesions at superficial layer III and near the layer IV and layer V border (100-μA, biphasic pulse, 1 ms per phase, 15 s). C: latency profile for responses to click stimulation. Minimum response latency occurs near 800 μm, corresponding to layer IIIb/IV. D: current-source density depth profile. Current sinks in black, sources in white. Minimum latency sinks are present between 600 and 1,100 μm (layer IIIb/IV), consistent with lemniscal thalamic input.
Fig. 2.
Fig. 2.
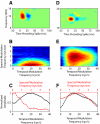
Spectrotemporal receptive fields (STRFs) and modulation transfer functions (MTFs) for 2 neurons. A: STRF for one neuron showing onoff response modulation along the temporal, but not spectral, dimension. B: ripple transfer function (RTF) of the STRF, showing temporal and spectral modulation preferences. C: temporal (black) and spectral (red) MTFs (tMTFs, sMTFs) obtained from the RTF by summing across the spectral and temporal dimensions, respectively. The onoff temporal pattern in the STRF leads to a band-pass tMTF. D: STRF for a different neuron showing onoff patterns along the temporal and spectral dimensions. E: RTF of the STRF shown in D. F: MTFs are now band-pass because of the temporal and spectral onoff patterns in the STRF in D.
Fig. 3.
Fig. 3.
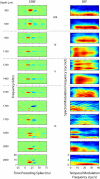
STRFs and RTFs from one penetration in primary auditory cortex. Left column: STRFs. Right column: RTFs. Each row represents one neuron, with the cortical depth of the neuron indicated to the left of the STRF. The structure of STRFs and RTFs is more variable outside of 800–1,100 μm.
Fig. 4.
Fig. 4.
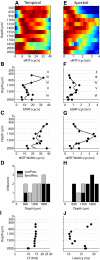
MTF profiles for the neurons in Fig. 3. Temporal (left column) and spectral (right column) MTFs and properties. First row (A, E) shows MTFs ordered by position. Second row (B, F) shows best temporal modulation frequency (bTMF). Third row (C, G) shows MTF width. Fourth row (D, H) shows MTF shape. I: characteristic frequency (CF) profile for the penetration. CF is relatively constant for cells in layers II–V. J: latency profile for the penetration. Latency is minimal at middle depths and increases at more superficial and deeper positions.
Fig. 5.
Fig. 5.
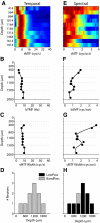
MTF profiles for a second example penetration. Figure is ordered exactly as Fig. 4. In this example, bTMFs and tMTF widths are relatively constant at different depths. Best spectral modulation frequencies (bSMFs) and sMTF widths are greatest at positions corresponding to corticocortical output layers.
Fig. 6.
Fig. 6.
Global laminar variations of MTF parameters. The top row shows example difference histograms that were used to determine whether layer parameter differences were significant. The bottom row shows schematics for bTMF and MTF width. Each schematic describes whether values in one layer were different from values in other layers. Each circle represents a separate layer. Solid lines between layers indicate the parameters were significantly different. Dashed lines indicate that the values were not significantly different. A: example difference histogram used to compare layer IV and layer VI bTMF. To compare the parameter values in different layers the MTF parameters in one layer in a penetration were subtracted from those in the other layer. The differences were pooled across penetrations and Wilcoxon signed-rank tests were performed. The analysis was performed on all possible layer combinations. BD: example difference histograms for tMTF width, bSMF, and sMTF width. E: layer IV bTMF values are greater than those in layers II/III and VI. Layer II/III and V values are also greater than those in layer VI for bTMF. F: tMTF width. G: bSMF. H: sMTF width.
Fig. 7.
Fig. 7.
Distribution of MTF shapes vs. cortical depth. A: tMTF shapes are mostly band-pass in lemniscal thalamic input layers of AI and become progressively more low-pass at deeper positions. B: sMTF shapes are largely low-pass within AI. Number above each bar represents the number of neurons in that bin.
Fig. 8.
Fig. 8.
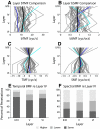
Best modulation frequency (BMF) trajectories in AI. Trajectories for all penetrations are shown. A: bTMF trajectories. B: bSMF trajectories. The value in each layer was obtained by taking the mean of BMFs of the recorded neurons in that layer. Each gray curve represents the trajectory of modulation information for one penetration. The black curve represents the mean layer values across all penetrations (n = 43; cyan: penetration in Fig. 4; blue: penetration in Fig. 5). C and D: trajectories as deviations from layer IV BMF values. E and F: BMF changes with respect to layer IV. The SD of layer IV BMFs was calculated. For each penetration, if a BMF in another layer differed by 1SD from the layer IV value, it was denoted as either higher or lower. E: in the majority of penetrations, bTMFs were similar in different layers. F: bSMFs were variable across layer, with many layers having higher bSMFs than layer IV.
Fig. 9.
Fig. 9.
MTF hierarchical congruity analysis. The 2 main laminar connection patterns (layer IV to layer II/III; layer II/III to layer V) were analyzed. For each neuron in a penetration, the common passband between the 2 layers was computed. The value was then normalized by either the passband of the source layer (Coverage) or by the target layer (Overlap). If multiple comparisons in a penetration were available, the mean was computed. Figure insets depict possible MTF configurations. A: temporal MTF congruity for layer IV to layer II/III. Values along diagonal indicate that in many penetrations the passbands for the 2 layers were similar. B: temporal MTF congruity for layer II/III to layer V. Values below the diagonal cannot be explained by a simple feedforward model. C and D: spectral MTF congruity for layer IV to layer II/III and for layer II/III to layer V.

Similar articles

Cited by

References

    1. Abeles M, Goldstein MH., Jr Functional architecture in cat primary auditory cortex: columnar organization and organization according to depth. J Neurophysiol 33: 172–187, 1970 - PubMed
    1. Adams DL, Horton JC. Capricious expression of cortical columns in the primate brain. Nat Neurosci 6: 113–114, 2003 - PubMed
    1. Aertsen A, Johannesma PI. Spectro-temporal receptive fields of auditory neurons in the grassfrog. I. Characterization of tonal and natural stimuli. Biol Cybern 38: 223–234, 1980 - PubMed
    1. Ahissar E, Sosnik R, Bagdasarian K, Haidarliu S. Temporal frequency of whisker movement. II. Laminar organization of cortical representations. J Neurophysiol 86: 354–367, 2001 - PubMed
    1. Ahmed B, Garcia-Lazaro JA, Schnupp JW. Response linearity in primary auditory cortex of the ferret. J Physiol 572: 763–773, 2006 - PMC - PubMed

Publication types

LinkOut - more resources