

The Nup107-160 nucleoporin complex promotes mitotic events via control of the localization state of the chromosome passenger complex
- PMID: 19864462
- PMCID: PMC2793300
- DOI: 10.1091/mbc.e09-05-0377
The Nup107-160 nucleoporin complex promotes mitotic events via control of the localization state of the chromosome passenger complex
Abstract
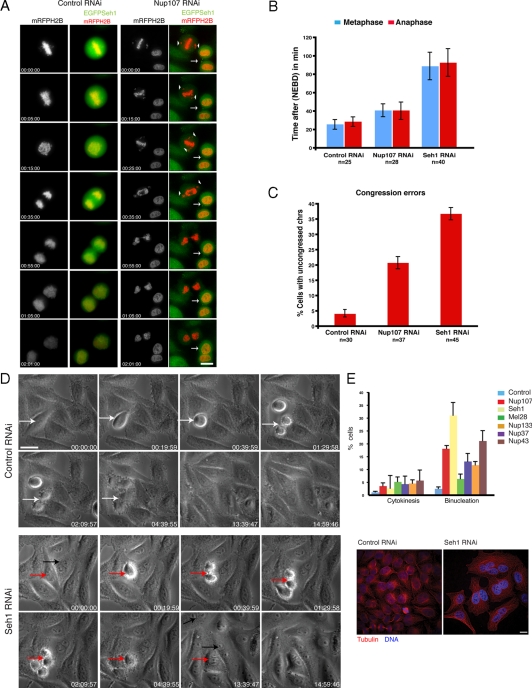
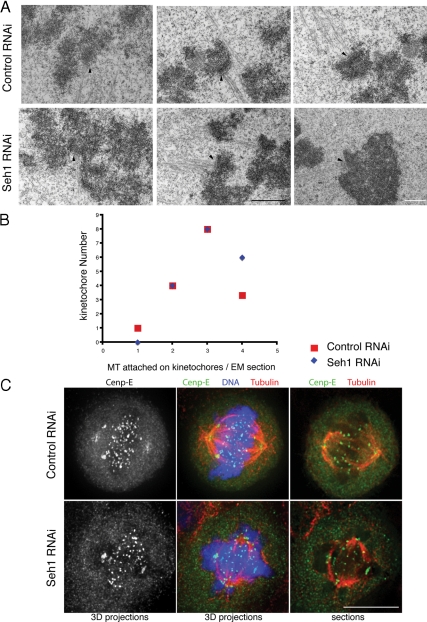
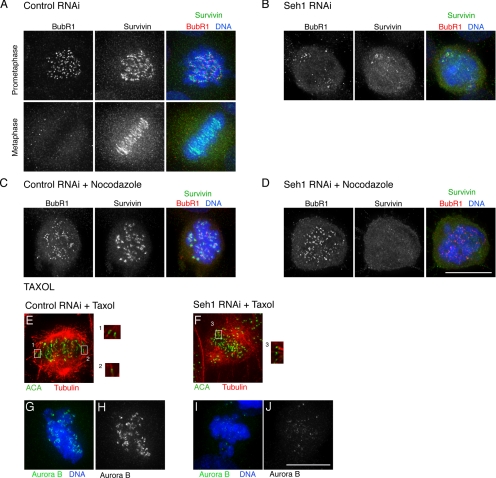
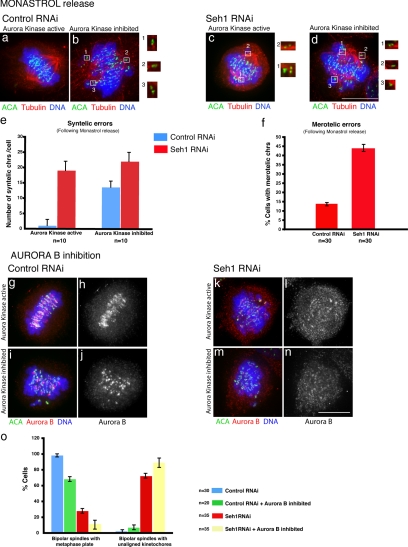
The human Nup107-160 nucleoporin complex plays a major role in formation of the nuclear pore complex and is localized to kinetochores in mitosis. Here we report that Seh1, a component of the Nup107-160 complex, functions in chromosome alignment and segregation by regulating the centromeric localization of Aurora B and other chromosome passenger complex proteins. Localization of CENP-E is not affected by Seh1 depletion and analysis by electron microscopy showed that microtubule kinetochore attachments are intact. Seh1-depleted cells show impaired Aurora B localization, which results in severe defects in biorientation and organization of the spindle midzone and midbody. Our results indicate that a major function of the Nup107 complex in mitosis is to ensure the proper localization of the CPC at the centromere.
Figures
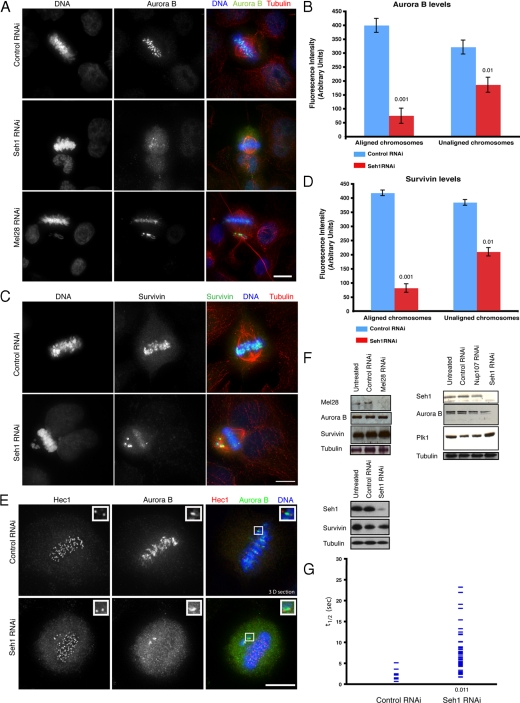
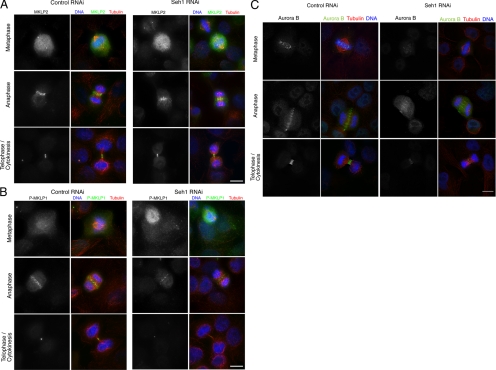
 ). Significance: p values from Student's t test are shown; n = 40 from two different experiments. Note the reduction in metaphase, anaphase, and midbody of Aurora B signal and corresponding reduction P-MKLP1. Scale bar, 10 μm.
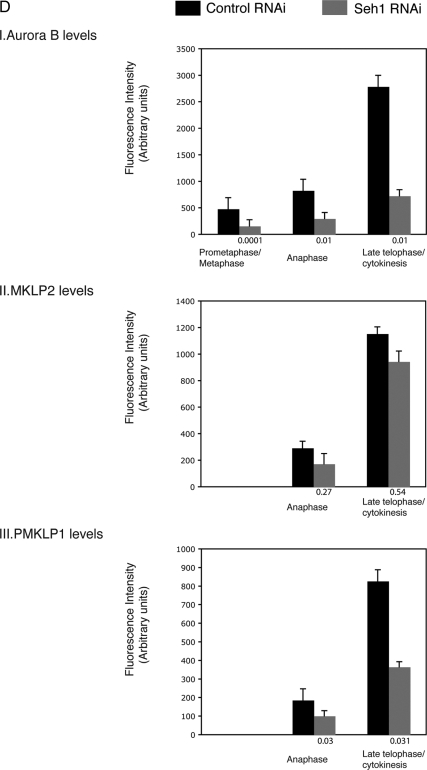 ). Significance: p values from Student's t test are shown; n = 40 from two different experiments. Note the reduction in metaphase, anaphase, and midbody of Aurora B signal and corresponding reduction P-MKLP1. Scale bar, 10 μm.
Similar articles
-
The human Nup107-160 nuclear pore subcomplex contributes to proper kinetochore functions.EMBO J. 2007 Apr 4;26(7):1853-64. doi: 10.1038/sj.emboj.7601642. Epub 2007 Mar 15. EMBO J. 2007. PMID: 17363900 Free PMC article.
-
Aurora B couples chromosome alignment with anaphase by targeting BubR1, Mad2, and Cenp-E to kinetochores.J Cell Biol. 2003 Apr 28;161(2):267-80. doi: 10.1083/jcb.200208091. J Cell Biol. 2003. PMID: 12719470 Free PMC article.
-
The small molecule Hesperadin reveals a role for Aurora B in correcting kinetochore-microtubule attachment and in maintaining the spindle assembly checkpoint.J Cell Biol. 2003 Apr 28;161(2):281-94. doi: 10.1083/jcb.200208092. Epub 2003 Apr 21. J Cell Biol. 2003. PMID: 12707311 Free PMC article.
-
Regulation of kinetochore-microtubule attachments by Aurora B kinase.Biochem Soc Trans. 2009 Oct;37(Pt 5):976-80. doi: 10.1042/BST0370976. Biochem Soc Trans. 2009. PMID: 19754435 Review.
-
Role of chromosomal passenger complex in chromosome segregation and cytokinesis.Cell Struct Funct. 2001 Dec;26(6):653-7. doi: 10.1247/csf.26.653. Cell Struct Funct. 2001. PMID: 11942622 Review.
Cited by
-
Nuclear transport proteins: structure, function, and disease relevance.Signal Transduct Target Ther. 2023 Nov 10;8(1):425. doi: 10.1038/s41392-023-01649-4. Signal Transduct Target Ther. 2023. PMID: 37945593 Free PMC article. Review.
-
Advances in the understanding of nuclear pore complexes in human diseases.J Cancer Res Clin Oncol. 2024 Jul 30;150(7):374. doi: 10.1007/s00432-024-05881-5. J Cancer Res Clin Oncol. 2024. PMID: 39080077 Free PMC article. Review.
-
SENP1 and SENP2 affect spatial and temporal control of sumoylation in mitosis.Mol Biol Cell. 2013 Nov;24(22):3483-95. doi: 10.1091/mbc.E13-05-0230. Epub 2013 Sep 18. Mol Biol Cell. 2013. PMID: 24048451 Free PMC article.
-
A Nup133-dependent NPC-anchored network tethers centrosomes to the nuclear envelope in prophase.J Cell Biol. 2011 Mar 7;192(5):855-71. doi: 10.1083/jcb.201007118. J Cell Biol. 2011. PMID: 21383080 Free PMC article.
-
Seh1 targets GATOR2 and Nup153 to mitotic chromosomes.J Cell Sci. 2018 May 1;131(9):jcs213140. doi: 10.1242/jcs.213140. J Cell Sci. 2018. PMID: 29618633 Free PMC article.
References
-
- Allen T. D., Cronshaw J. M., Bagley S., Kiseleva E., Goldberg M. W. The nuclear pore complex: mediator of translocation between nucleus and cytoplasm. J. Cell Sci. 2000;113(Pt 10):1651–1659. - PubMed
-
- Andrews P. D. Cell of the month: two telophase HeLa cells expressing GFP-tagged human Aurora B. Nat. Rev. Mol. Cell. Biol. 2003;4:92–93.
-
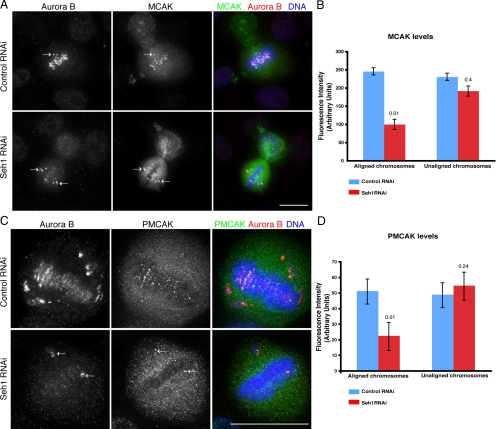
- Andrews P. D., Ovechkina Y., Morrice N., Wagenbach M., Duncan K., Wordeman L., Swedlow J. R. Aurora B regulates MCAK at the mitotic centromere. Dev. Cell. 2004;6:253–268. - PubMed
-
- Antonin W., Ellenberg J., Dultz E. Nuclear pore complex assembly through the cell cycle: regulation and membrane organization. FEBS Lett. 2008;582:2004–2016. - PubMed
-
- Arnaoutov A., Azuma Y., Ribbeck K., Joseph J., Boyarchuk Y., Karpova T., McNally J., Dasso M. Crm1 is a mitotic effector of Ran-GTP in somatic cells. Nat. Cell Biol. 2005;7:626–632. - PubMed
Publication types
MeSH terms
Substances
Grants and funding
LinkOut - more resources
Full Text Sources
Research Materials
Miscellaneous
