

Experimental design and data analysis in receiver operating characteristic studies: lessons learned from reports in radiology from 1997 to 2006
- PMID: 19864510
- PMCID: PMC2786192
- DOI: 10.1148/radiol.2533081632
Experimental design and data analysis in receiver operating characteristic studies: lessons learned from reports in radiology from 1997 to 2006
Abstract
Purpose: To provide a broad perspective concerning the recent use of receiver operating characteristic (ROC) analysis in medical imaging by reviewing ROC studies published in Radiology between 1997 and 2006 for experimental design, imaging modality, medical condition, and ROC paradigm.
Materials and methods: Two hundred ninety-five studies were obtained by conducting a literature search with PubMed with two criteria: publication in Radiology between 1997 and 2006 and occurrence of the phrase "receiver operating characteristic." Studies returned by the query that were not diagnostic imaging procedure performance evaluations were excluded. Characteristics of the remaining studies were tabulated.
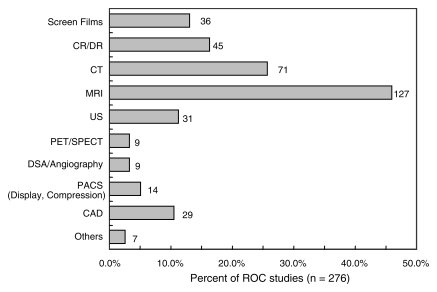
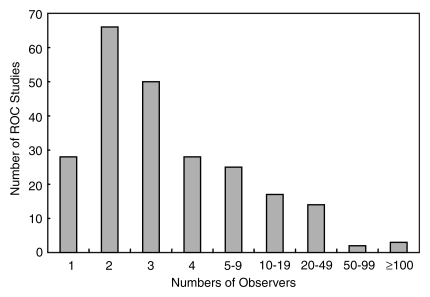
Results: Two hundred thirty-three (79.0%) of the 295 studies reported findings based on observers' diagnostic judgments or objective measurements. Forty-three (14.6%) did not include human observers, with most of these reporting an evaluation of a computer-aided diagnosis system or functional data obtained with computed tomography (CT) or magnetic resonance (MR) imaging. The remaining 19 (6.4%) studies were classified as reviews or meta-analyses and were excluded from our subsequent analysis. Among the various imaging modalities, MR imaging (46.0%) and CT (25.7%) were investigated most frequently. Approximately 60% (144 of 233) of ROC studies with human observers published in Radiology included three or fewer observers.
Conclusion: ROC analysis is widely used in radiologic research, confirming its fundamental role in assessing diagnostic performance. However, the ROC studies reported in Radiology were not always adequate to support clear and clinically relevant conclusions.
Figures
References
-
- Green DM, Swets JA. Signal detection theory and psychophysics New York, NY: Krieger, 1974
-
- Lusted L. Introduction to medical decision making Springfield, Ill: Charles C Thomas, 1968
-
- Lusted LB. Signal detectability and medical decision-making. Science 1971;171:1217–1219 - PubMed
-
- Swets JA. Measuring the accuracy of diagnostic systems. Science 1988;240:1285–1293 - PubMed
-
- Goodenough DJ, Rossmann K, Lusted LB. Radiographic applications of receiver operating characteristic (ROC) curves. Radiology 1974;110:89–95 - PubMed
Publication types
MeSH terms
Grants and funding
LinkOut - more resources
Full Text Sources
Other Literature Sources
Medical
