

Intensive Care Unit Insulin Delivery Algorithms: Why So Many? How to Choose?
- PMID: 19865614
- PMCID: PMC2768418
- DOI: 10.1177/193229680900300114
Intensive Care Unit Insulin Delivery Algorithms: Why So Many? How to Choose?
Abstract
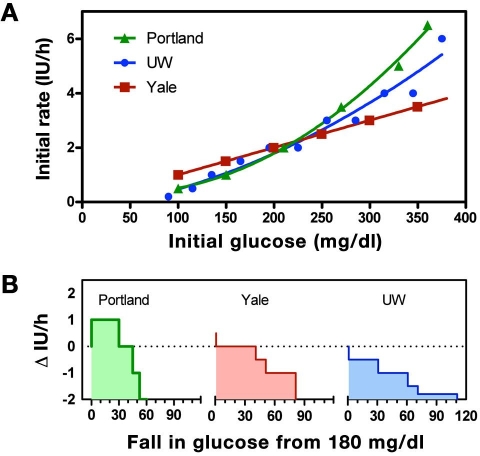
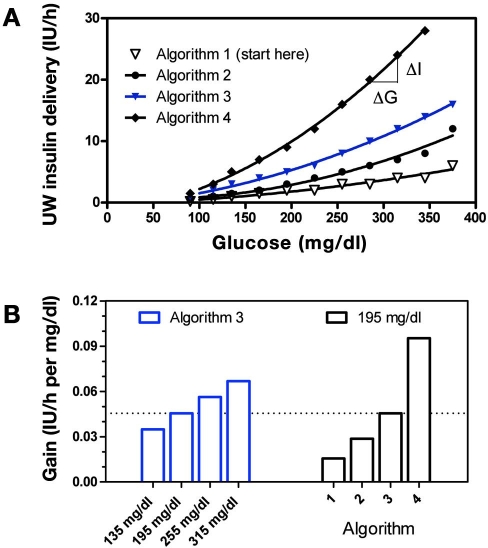
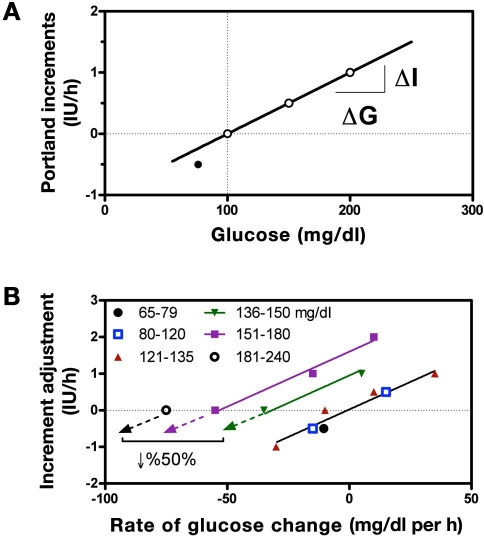
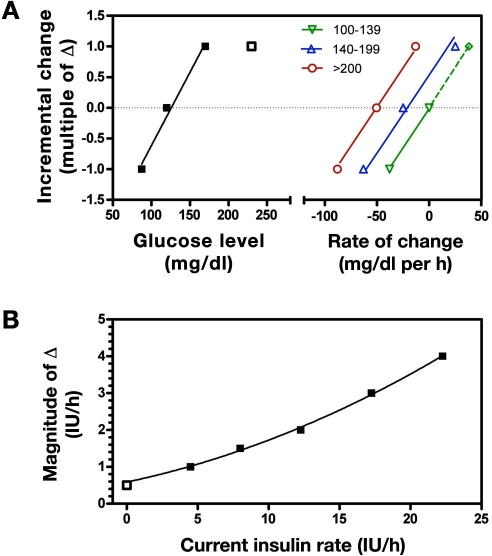
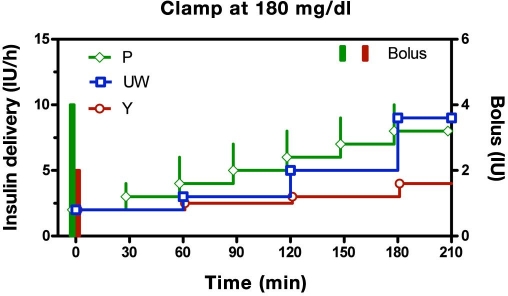
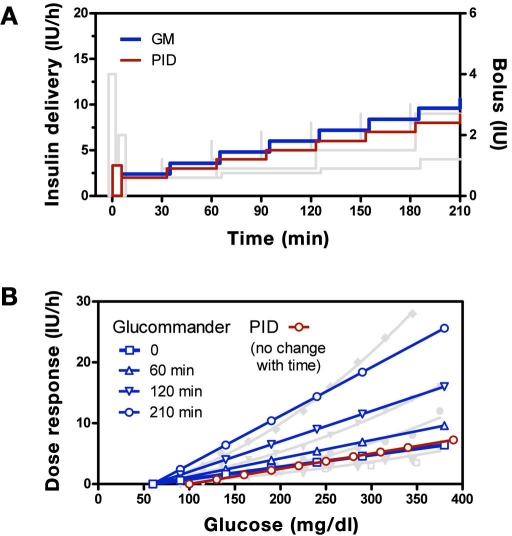
OBJECTIVE: Studies showing improved outcomes with tight glycemic control in the intensive care unit (ICU) have resulted in a substantial number of new insulin delivery algorithms being proposed. The present study highlights mechanisms used in the better-known approaches, examines what might be critical differences among them, and uses systems theory to characterize the conditions under which each can be expected to perform best. METHODS: Algorithm dose (DeltaI/DeltaG) and step (response to a persistent elevation in glucose) response curves were calculated for written instruction algorithms, developed at the Providence Heart and Vascular Institute (Portland [P] protocol), the University of Washington (UW), and Yale University (Y), together with similar curves for the Glucommander (GM) and proportional integral derivative (PID) computer algorithms. From the simulated curves, different mechanisms used to adjust insulin delivery were identified. RESULTS: All algorithms increased insulin delivery in response to persistent hyperglycemia, but the mechanism used altered the algorithm's sensitivity to glucose, or gain, in the GM, UW, and Y protocols, while leaving it unchanged for the P protocol and PID algorithm. CONCLUSIONS: The increase in insulin delivery in response to persistent hyperglycemia observed with all the algorithms can be expected to bring subjects who respond to insulin to targeted glucose ranges. However, because the PID and P protocols did not alter the insulin delivery response curves, these algorithms can be expected to take longer to achieve target glucose levels in individuals who are insulin resistant and/or are exposed to increased carbohydrate loads (e.g., glucose infusions). By contrast, the GM, UW, and Y algorithms can be expected to adapt to the insulin resistance such that the time to achieve target levels is unchanged if the time for insulin to act does not change. If the insulin resistance is accompanied by a longer time for insulin to act, the UW, Y, and GM algorithms may increase the risk of hypoglycemia. Under these conditions, the longer time required for the PID and P protocols to achieve a target glucose level may be a reasonable trade-off for no increase in the risk of hypoglycemia.
Figures
References
-
- Furnary AP, Wu Y, Bookin SO. Effect of hyperglycemia and continuous intravenous insulin infusions on outcomes of cardiac surgical procedures: the Portland Diabetic Project. Endocr Pract. 2004;10(Suppl 2):21–33. - PubMed
-
- Trence DL, Kelly JL, Hirsch IB. The rationale and management of hyperglycemia for in-patients with cardiovascular disease: time for change. J Clin Endocrinol Metab. 2003;88(6):2430–2437. - PubMed
-
- Goldberg PA, Siegel MD, Sherwin RS, Halickman JI, Lee M, Bailey VA, Lee SL, Dziura JD, Inzucci SE. Implementation of a safe and effective insulin infusion protocol in a medical intensive care unit. Diabetes Care. 2004;27:461–467. - PubMed
-
- Wilson M, Weinreb J, Hoo GW. Intensive insulin therapy in critical care: a review of 12 protocols. Diabetes Care. 2007;30(4):1005–1011. - PubMed
-
- Workbook for Improvement: Improving Glycemic Control, Preventing Hypoglycemia, and Optimizing Care of vthe Inpatient with Hyperglycemia and Diabetes. Society of Hospital Medicine. http://www.hospitalmedicine.org/. Accessed March 10, 2008.
Grants and funding
LinkOut - more resources
Full Text Sources
Other Literature Sources
