

Organic compound characterization and source apportionment of indoor and outdoor quasi-ultrafine particulate matter in retirement homes of the Los Angeles Basin
- PMID: 19874400
- PMCID: PMC3781020
- DOI: 10.1111/j.1600-0668.2009.00620.x
Organic compound characterization and source apportionment of indoor and outdoor quasi-ultrafine particulate matter in retirement homes of the Los Angeles Basin
Abstract
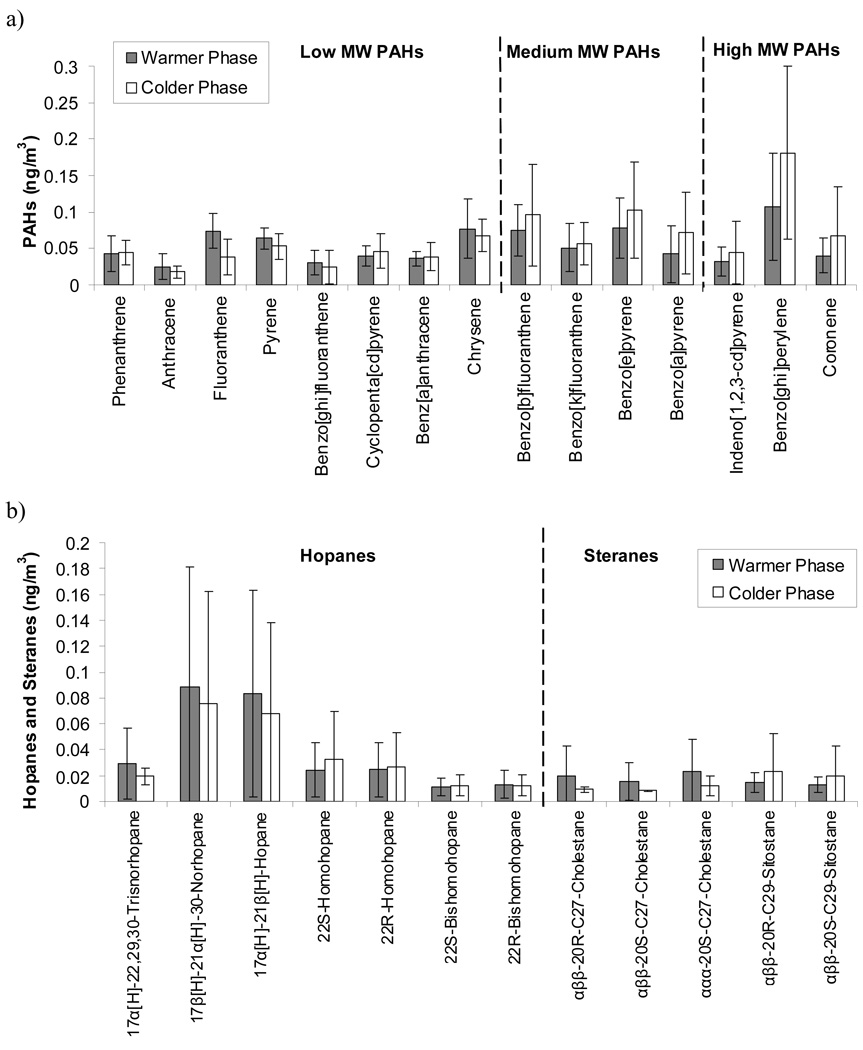
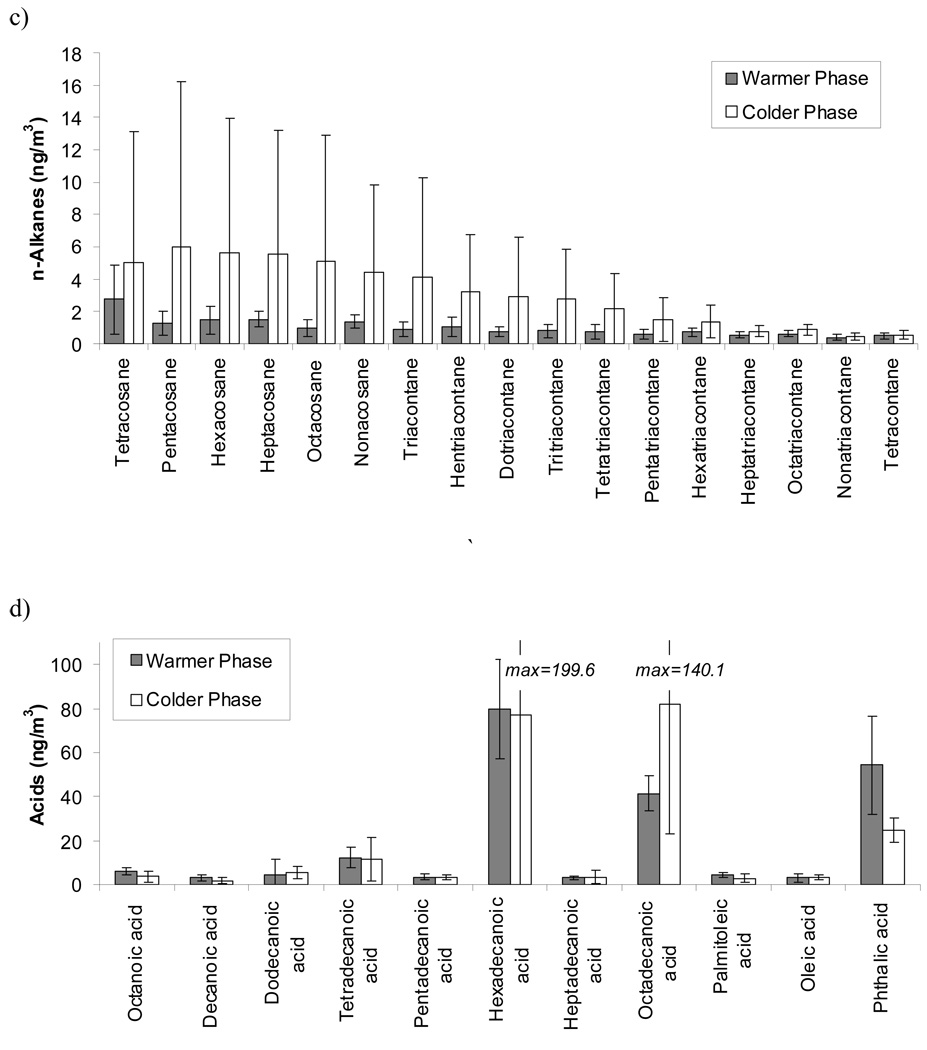
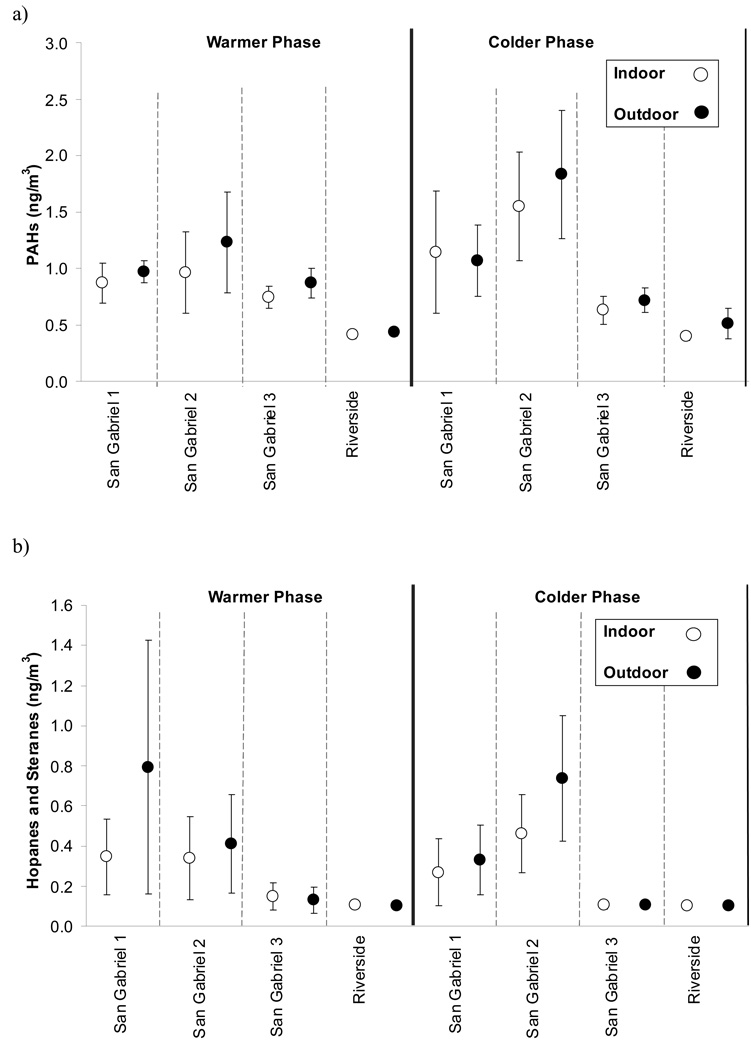
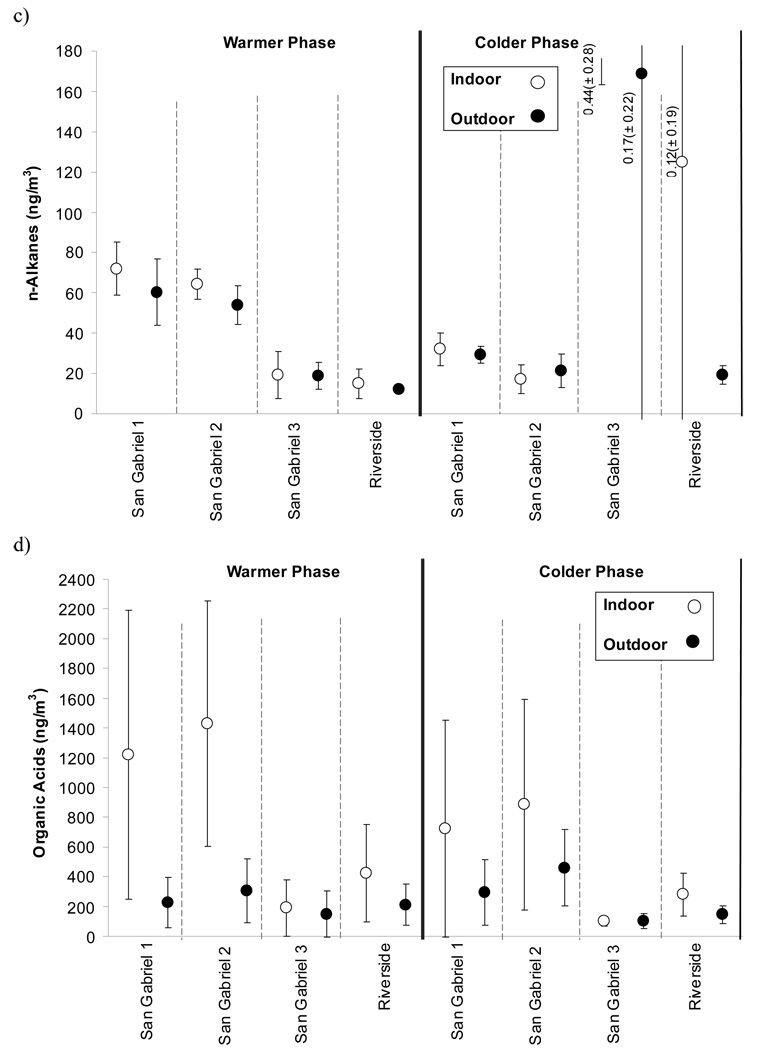
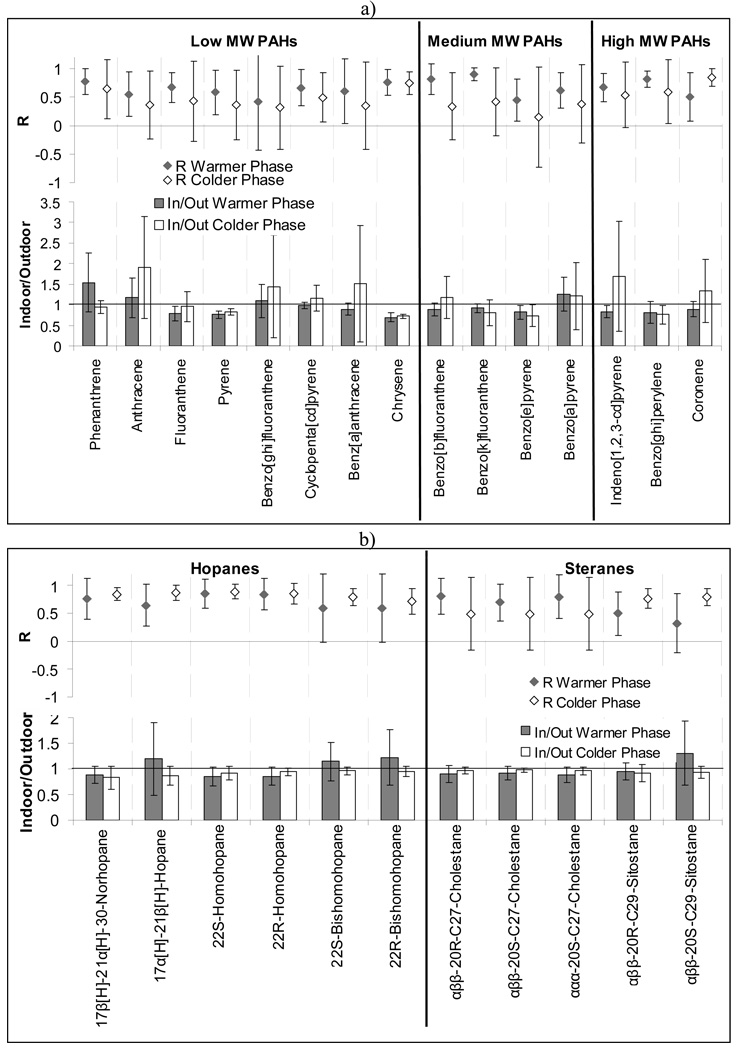
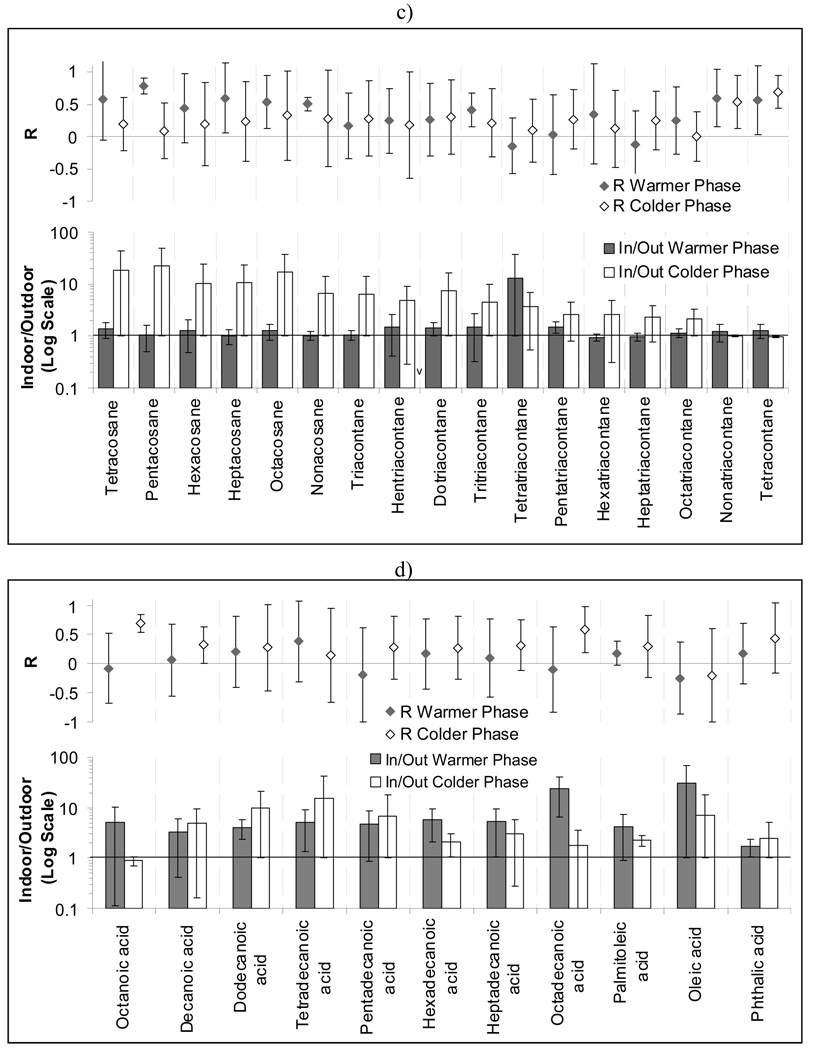
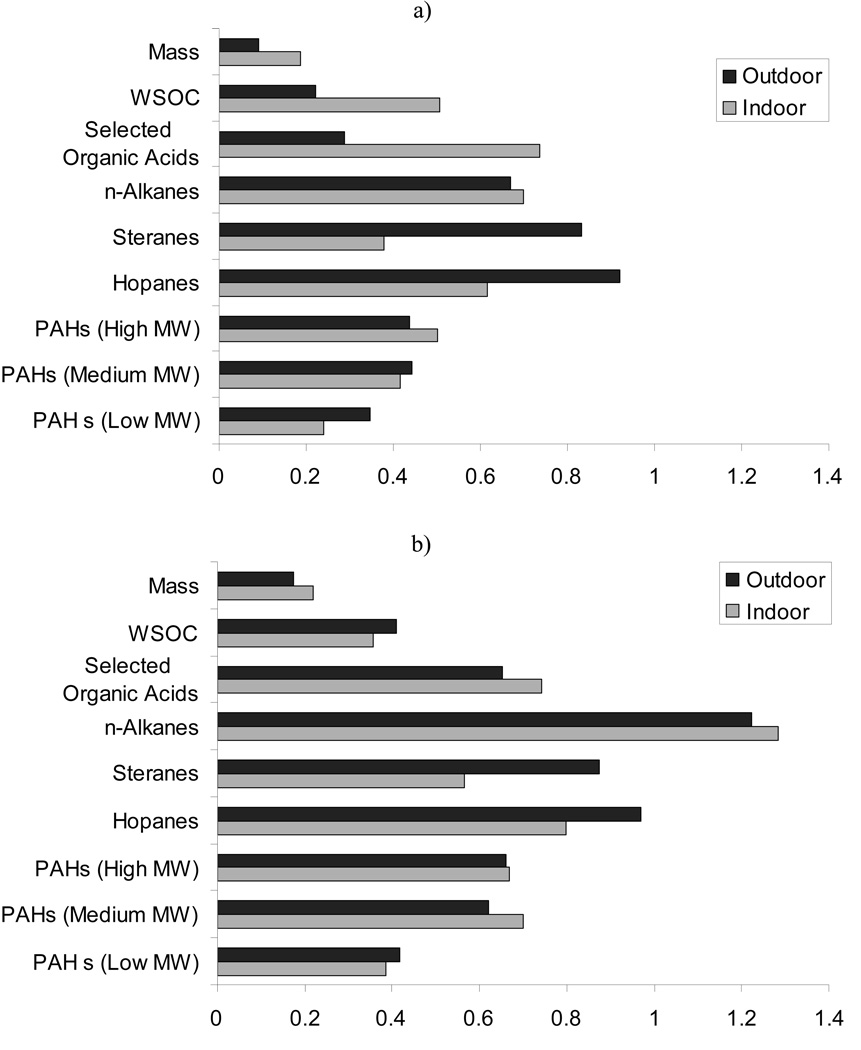
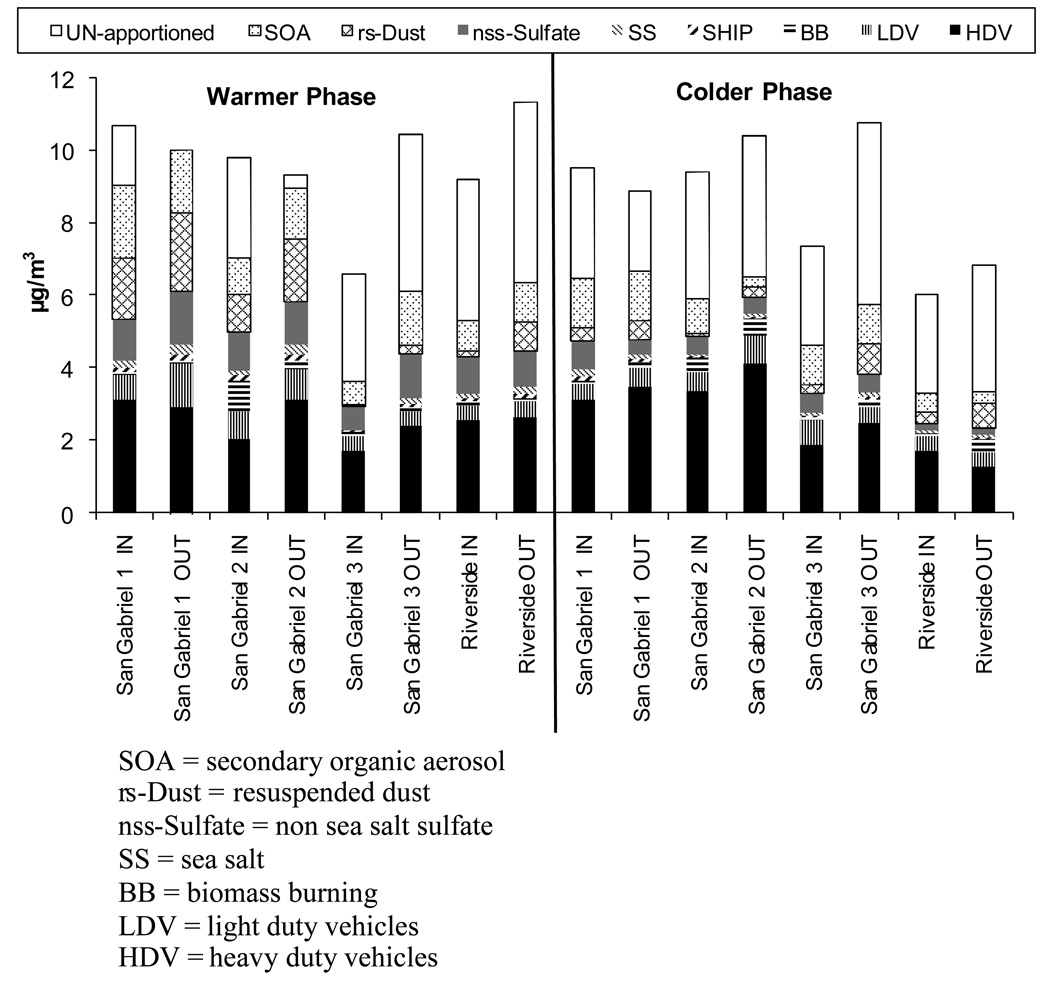
Quasi-ultrafine (quasi-UF) particulate matter (PM(0.25)) and its components were measured in indoor and outdoor environments at four retirement communities in Los Angeles Basin, California, as part of the Cardiovascular Health and Air Pollution Study (CHAPS). The present paper focuses on the characterization of the sources, organic constituents and indoor and outdoor relationships of quasi-UF PM. The average indoor/outdoor ratios of most of the measured polycyclic aromatic hydrocarbons (PAHs), hopanes, and steranes were close to or slightly lower than 1, and the corresponding indoor-outdoor correlation coefficients (R) were always positive and, for the most part, moderately strong (median R was 0.60 for PAHs and 0.74 for hopanes and steranes). This may reflect the possible impact of outdoor sources on indoor PAHs, hopanes, and steranes. Conversely, indoor n-alkanes and n-alkanoic acids were likely to be influenced by indoor sources. A chemical mass balance model was applied to both indoor and outdoor speciated chemical measurements of quasi-UF PM. Among all apportioned sources of both indoor and outdoor particles, vehicular emissions was the one contributing the most to the PM(0.25) mass concentration measured at all sites (24-47% on average).
Practical implications: Although people (particularly the elderly retirees of our study) generally spend most of their time indoors, a major portion of the PM(0.25) particles they are exposed to comes from outdoor mobile sources. This is important because, an earlier investigation, also conducted within the Cardiovascular Health and Air Pollution Study (CHAPS), showed that indoor-infiltrated particles from mobile sources are more strongly correlated with adverse health effects observed in the elderly subjects living in the studied retirement communities compared with other particles found indoors (Delfino et al., 2008).
Figures
References
-
- Abt E, Suh HH, Catalano P, Koutrakis P. Relative contribution of outdoor and indoor particle sources to indoor concentrations. Environmental Science & Technology. 2000;34:3579–3587.
-
- Agrawal H, Malloy QGJ, Welch WA, Miller JW, Cocker DR. In-use gaseous and particulate matter emissions from a modern ocean going container vessel. Atmospheric Environment. 2008;42:5504–5510.
-
- Allen R, Larson T, Sheppard L, Wallace L, Liu L. Use of Real-Time Light Scattering Data to Estimate the Contribution of Infiltrated and Indoor-Generated Particles to Indoor Air. Environmental Science & Technology. 2003;37:3484–3492. - PubMed
-
- Araujo JA, Barajas B, Kleinman M, Wang XP, Bennett BJ, Gong KW, Navab M, Harkema J, Sioutas C, Lusis AJ, Nel A. Ambient particulate pollutants in the ultrafine range promote atherosclerosis and systemic oxidative stress. Arteriosclerosis Thrombosis and Vascular Biology. 2007;27:E39–E39. - PMC - PubMed
-
- Arhami M, Kuhn T, Fine PM, Delfino RJ, Sioutas C. Effects of sampling artifacts and operating parameters on the performance of a semicontinuous particulate elemental carbon/organic carbon monitor. Environmental Science & Technology. 2006;40:945–954. - PubMed
Publication types
MeSH terms
Substances
Grants and funding
LinkOut - more resources
Full Text Sources
