

Predicting sulfotyrosine sites using the random forest algorithm with significantly improved prediction accuracy
- PMID: 19874585
- PMCID: PMC2777180
- DOI: 10.1186/1471-2105-10-361
Predicting sulfotyrosine sites using the random forest algorithm with significantly improved prediction accuracy
Abstract
Background: Tyrosine sulfation is one of the most important posttranslational modifications. Due to its relevance to various disease developments, tyrosine sulfation has become the target for drug design. In order to facilitate efficient drug design, accurate prediction of sulfotyrosine sites is desirable. A predictor published seven years ago has been very successful with claimed prediction accuracy of 98%. However, it has a particularly low sensitivity when predicting sulfotyrosine sites in some newly sequenced proteins.
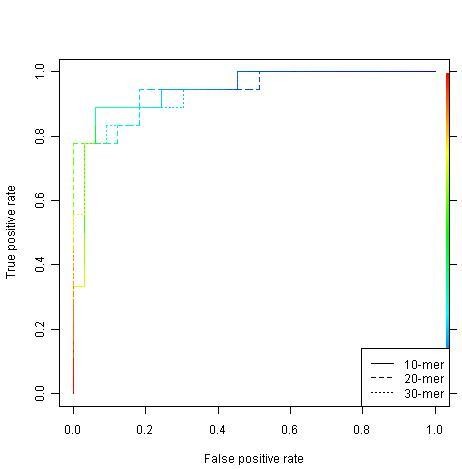
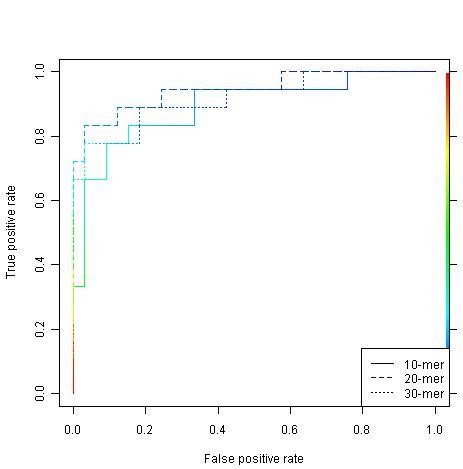
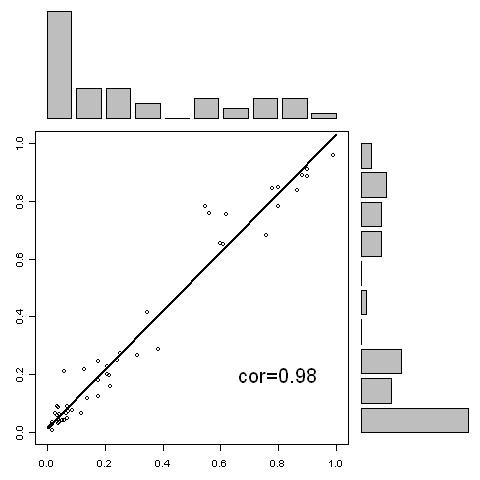
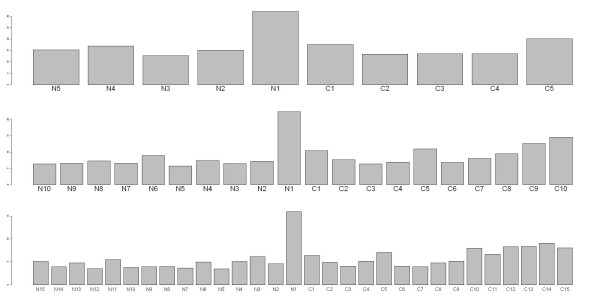
Results: A new approach has been developed for predicting sulfotyrosine sites using the random forest algorithm after a careful evaluation of seven machine learning algorithms. Peptides are formed by consecutive residues symmetrically flanking tyrosine sites. They are then encoded using an amino acid hydrophobicity scale. This new approach has increased the sensitivity by 22%, the specificity by 3%, and the total prediction accuracy by 10% compared with the previous predictor using the same blind data. Meanwhile, both negative and positive predictive powers have been increased by 9%. In addition, the random forest model has an excellent feature for ranking the residues flanking tyrosine sites, hence providing more information for further investigating the tyrosine sulfation mechanism. A web tool has been implemented at http://ecsb.ex.ac.uk/sulfotyrosine for public use.
Conclusion: The random forest algorithm is able to deliver a better model compared with the Hidden Markov Model, the support vector machine, artificial neural networks, and others for predicting sulfotyrosine sites. The success shows that the random forest algorithm together with an amino acid hydrophobicity scale encoding can be a good candidate for peptide classification.
Figures

Similar articles
-
PredSulSite: prediction of protein tyrosine sulfation sites with multiple features and analysis.Anal Biochem. 2012 Sep 1;428(1):16-23. doi: 10.1016/j.ab.2012.06.003. Epub 2012 Jun 9. Anal Biochem. 2012. PMID: 22691961
-
Prediction of protein binding sites in protein structures using hidden Markov support vector machine.BMC Bioinformatics. 2009 Nov 20;10:381. doi: 10.1186/1471-2105-10-381. BMC Bioinformatics. 2009. PMID: 19925685 Free PMC article.
-
Prediction of RNA-binding residues in proteins from primary sequence using an enriched random forest model with a novel hybrid feature.Proteins. 2011 Apr;79(4):1230-9. doi: 10.1002/prot.22958. Epub 2011 Jan 25. Proteins. 2011. PMID: 21268114
-
Comprehensive review and assessment of computational methods for predicting RNA post-transcriptional modification sites from RNA sequences.Brief Bioinform. 2020 Sep 25;21(5):1676-1696. doi: 10.1093/bib/bbz112. Brief Bioinform. 2020. PMID: 31714956 Review.
-
An Overview of Computational Tools of Nucleic Acid Binding Site Prediction for Site-specific Proteins and Nucleases.Protein Pept Lett. 2020;27(5):370-384. doi: 10.2174/0929866526666191028162302. Protein Pept Lett. 2020. PMID: 31746287 Review.
Cited by
-
Characterization and prediction of positional 4-hydroxyproline and sulfotyrosine, two post-translational modifications that can occur at substantial levels in CHO cells-expressed biotherapeutics.MAbs. 2019 Oct;11(7):1219-1232. doi: 10.1080/19420862.2019.1635865. Epub 2019 Jul 24. MAbs. 2019. PMID: 31339437 Free PMC article.
-
Identification of tyrosine sulfation in the variable region of a bispecific antibody and its effect on stability and biological activity.MAbs. 2023 Jan-Dec;15(1):2259289. doi: 10.1080/19420862.2023.2259289. Epub 2023 Sep 24. MAbs. 2023. PMID: 37742207 Free PMC article.
-
A potential antibody repertoire diversification mechanism through tyrosine sulfation for biotherapeutics engineering and production.Front Immunol. 2022 Dec 8;13:1072702. doi: 10.3389/fimmu.2022.1072702. eCollection 2022. Front Immunol. 2022. PMID: 36569848 Free PMC article.
-
A Novel Phosphorylation Site-Kinase Network-Based Method for the Accurate Prediction of Kinase-Substrate Relationships.Biomed Res Int. 2017;2017:1826496. doi: 10.1155/2017/1826496. Epub 2017 Oct 12. Biomed Res Int. 2017. PMID: 29312990 Free PMC article.
-
In silico prediction of post-translational modifications in therapeutic antibodies.MAbs. 2022 Jan-Dec;14(1):2023938. doi: 10.1080/19420862.2021.2023938. MAbs. 2022. PMID: 35040751 Free PMC article. Review.
References
-
- Hille A, Rosa P, Huttner WB. Tyrosine sulfation: a post-translational modification of proteins destined for secretion? FEBS Lett. 1984;177:129–134. - PubMed
-
- Andersen BN. Species variation in the tyrosine sulfation of mammalian gastrins. Gen Comp Endocrinol. 1985;58:44–50. - PubMed
-
- Negishi M, Pedersen LG, Petrotchenko E, Shevtsov S, Gorokhov A, Kakuta Y, Pedersen LC. Structure and function of sulfotransferases. Arch Biochem Biophys. 2001;390:149–157. - PubMed
-
- Leitinger B, Brown JL, Spies M. Tagging secretory and membrane proteins witha tyrosine sulfation site. The Journal of Biological Chemistry. 1984;269:8115–8121. - PubMed
Publication types
MeSH terms
Substances
LinkOut - more resources
Full Text Sources
