

Inferring branching pathways in genome-scale metabolic networks
- PMID: 19874610
- PMCID: PMC2791103
- DOI: 10.1186/1752-0509-3-103
Inferring branching pathways in genome-scale metabolic networks
Abstract
Background: A central problem in computational metabolic modelling is how to find biochemically plausible pathways between metabolites in a metabolic network. Two general, complementary frameworks have been utilized to find metabolic pathways: constraint-based modelling and graph-theoretical path finding approaches. In constraint-based modelling, one aims to find pathways where metabolites are balanced in a pseudo steady-state. Constraint-based methods, such as elementary flux mode analysis, have typically a high computational cost stemming from a large number of steady-state pathways in a typical metabolic network. On the other hand, graph-theoretical approaches avoid the computational complexity of constraint-based methods by solving a simpler problem of finding shortest paths. However, while scaling well with network size, graph-theoretic methods generally tend to return more false positive pathways than constraint-based methods.
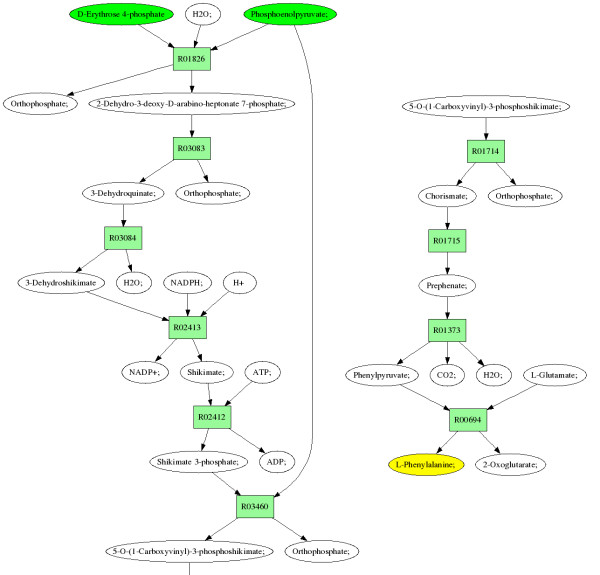
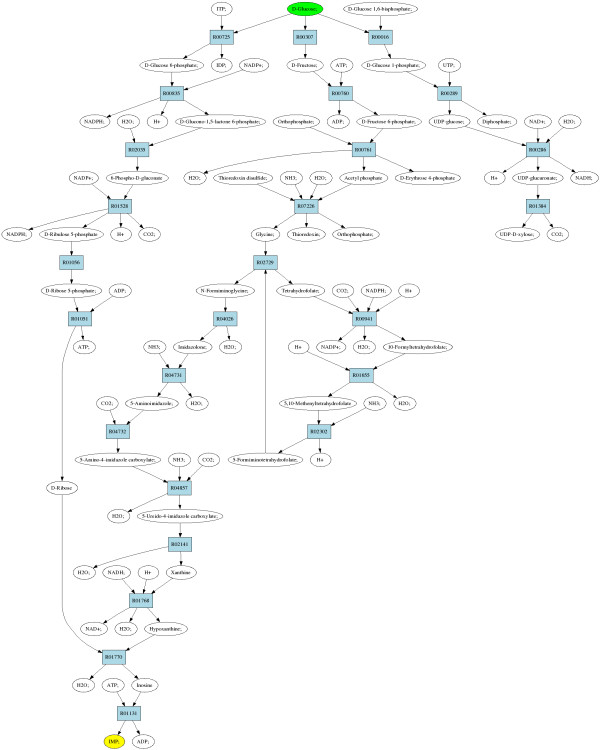
Results: In this paper, we introduce a computational method, ReTrace, for finding biochemically relevant, branching metabolic pathways in an atom-level representation of metabolic networks. The method finds compact pathways which transfer a high fraction of atoms from source to target metabolites by considering combinations of linear shortest paths. In contrast to current steady-state pathway analysis methods, our method scales up well and is able to operate on genome-scale models. Further, we show that the pathways produced are biochemically meaningful by an example involving the biosynthesis of inosine 5'-monophosphate (IMP). In particular, the method is able to avoid typical problems associated with graph-theoretic approaches such as the need to define side metabolites or pathways not carrying any net carbon flux appearing in results. Finally, we discuss an application involving reconstruction of amino acid pathways of a recently sequenced organism demonstrating how measurement data can be easily incorporated into ReTrace analysis. ReTrace is licensed under GPL and is freely available for academic use at http://www.cs.helsinki.fi/group/sysfys/software/retrace/.
Conclusion: ReTrace is a useful method in metabolic path finding tasks, combining some of the best aspects in constraint-based and graph-theoretic methods. It finds use in a multitude of tasks ranging from metabolic engineering to metabolic reconstruction of recently sequenced organisms.
Figures
 (r) = {a1, a2} and produces atoms
  (r) = {a3, a4}.
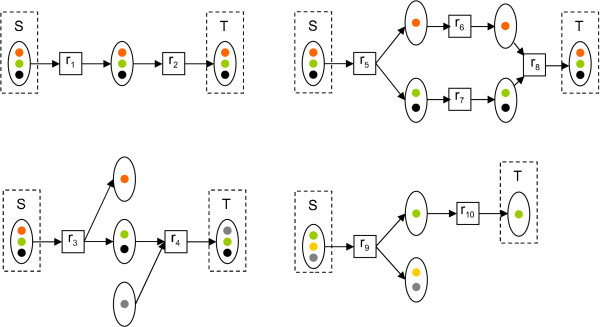
 = 1. Bottom left: pathway P2 = {r3, r4} transfers green and black atoms to T. Since grey atom is not in S, ZO (P2, S, T) =
  . Top right: branching pathway P3 = {r5, r6, r7, r8} transfers all atoms in S, resulting in ZO (P3, S, T) = 1. Bottom right: pathway P4 = {r9, r10} transfers the only target atom from S, giving ZO(P4, S, T) = 1. However, two atoms of S are not transferred to T.
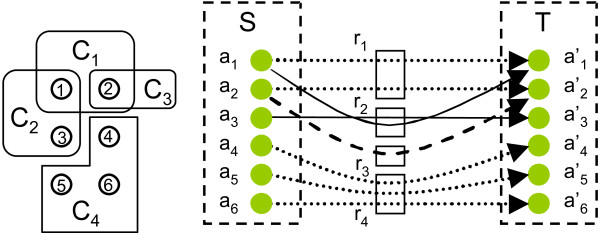
 = {s1, ..., s6} (circles) and subset collection
  = {C1, C2, C3, C4}. Right: Find-Minimal-Pathway instance corresponding to the set cover instance with 12 atoms and four reactions. Arrows denote mapping of atoms Γ over reactions. In particular, mappings shown with similarly dashed arrow lines belong to the same reaction. Source and target atom sets indicated with S and T.
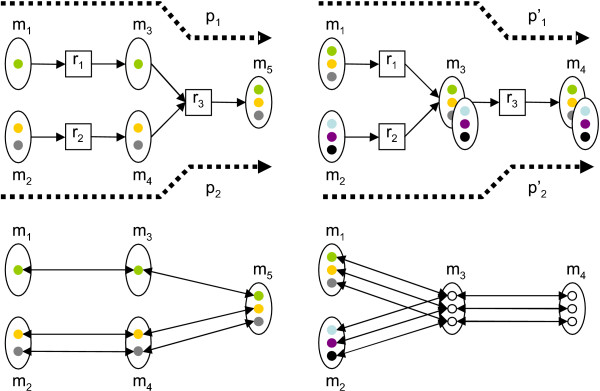
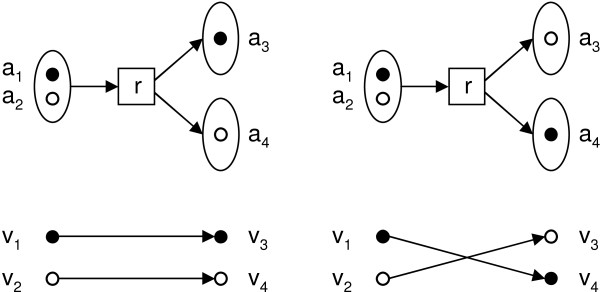
 = (r1, r3) and
  = (r2, r3) merge in metabolite m3. Subsequently, atoms from m1 and m2 are never transferred to the same instance of metabolite m3 via these paths. Bottom left and right: atom graph representations of pathways P (left) and P' (right). Hollow circles denote atoms which can originate from atoms in metabolites m1 or m2.
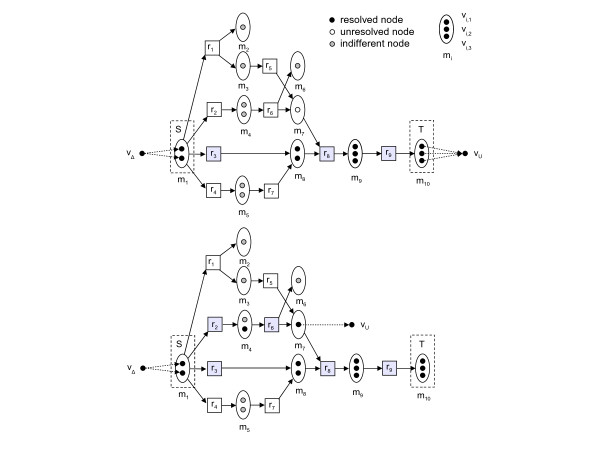
 = (vΔ, v1,1, v8,1, v9,2, v10,2, vU),
  = (vΔ, v1,2, v8,2, v9,3, v10,3, vU) and
  = (vΔ, v1,2, v4,2, v7,1, v9,1, v10,1, vU), with path length ties broken arbitrarily. Choosing to process first, the reaction set corresponding to the atom path is P' = {r3, r8, r9}. Tracing back from vU, ReTrace finds that v10,2 and v10,3 can be traced back to vΔ, while v7,1 is added to U. Procedure FindPath is then called recursively. Bottom: algorithm state after second call to Procedure FindPath. Edges to vU are updated to reflect U = {v7,1}. Shortest paths from vΔ to vU are computed. However, only two paths are found:
  = (vΔ, v1,2, v4,2, v7,1, vU) and
  = (vΔ, v1,2, v3,1, v7,1, vU). Choosing arbitrarily to process next, ReTrace finds out that the reaction set P' = {r2, r6} resolves the remaining atom in U and a complete pathway {r2, r3, r6, r8, r9} has been discovered.
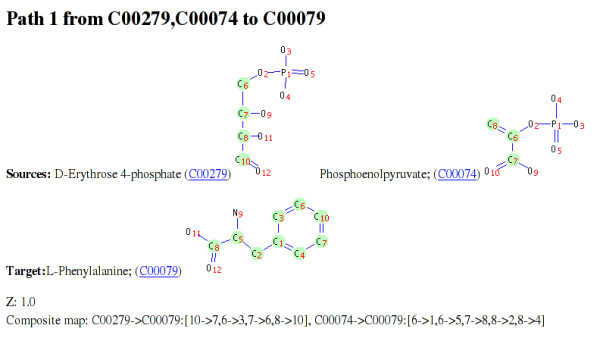

Similar articles
-
Symbolic flux analysis for genome-scale metabolic networks.BMC Syst Biol. 2011 May 23;5:81. doi: 10.1186/1752-0509-5-81. BMC Syst Biol. 2011. PMID: 21605414 Free PMC article.
-
Finding metabolic pathways using atom tracking.Bioinformatics. 2010 Jun 15;26(12):1548-55. doi: 10.1093/bioinformatics/btq223. Epub 2010 Apr 25. Bioinformatics. 2010. PMID: 20421197 Free PMC article.
-
Computing Elementary Flux Modes Involving a Set of Target Reactions.IEEE/ACM Trans Comput Biol Bioinform. 2014 Nov-Dec;11(6):1099-107. doi: 10.1109/TCBB.2014.2343964. IEEE/ACM Trans Comput Biol Bioinform. 2014. PMID: 26357047
-
Advances in network-based metabolic pathway analysis and gene expression data integration.Brief Bioinform. 2015 Mar;16(2):265-79. doi: 10.1093/bib/bbu009. Epub 2014 Mar 13. Brief Bioinform. 2015. PMID: 24626528 Review.
-
Use of CellNetAnalyzer in biotechnology and metabolic engineering.J Biotechnol. 2017 Nov 10;261:221-228. doi: 10.1016/j.jbiotec.2017.05.001. Epub 2017 May 10. J Biotechnol. 2017. PMID: 28499817 Review.
Cited by
-
A review of computational tools for design and reconstruction of metabolic pathways.Synth Syst Biotechnol. 2017 Nov 15;2(4):243-252. doi: 10.1016/j.synbio.2017.11.002. eCollection 2017 Dec. Synth Syst Biotechnol. 2017. PMID: 29552648 Free PMC article. Review.
-
Metabolic modelling in the development of cell factories by synthetic biology.Comput Struct Biotechnol J. 2012 Nov 12;3:e201210009. doi: 10.5936/csbj.201210009. eCollection 2012. Comput Struct Biotechnol J. 2012. PMID: 24688669 Free PMC article. Review.
-
Seeing the forest for the trees: Retrieving plant secondary biochemical pathways from metabolome networks.Comput Struct Biotechnol J. 2020 Dec 3;19:72-85. doi: 10.1016/j.csbj.2020.11.050. eCollection 2021. Comput Struct Biotechnol J. 2020. PMID: 33384856 Free PMC article. Review.
-
Mining the key regulatory genes of chicken inosine 5'-monophosphate metabolism based on time series microarray data.J Anim Sci Biotechnol. 2015 May 23;6(1):21. doi: 10.1186/s40104-015-0022-3. eCollection 2015. J Anim Sci Biotechnol. 2015. PMID: 26075067 Free PMC article.
-
MetaMapp: mapping and visualizing metabolomic data by integrating information from biochemical pathways and chemical and mass spectral similarity.BMC Bioinformatics. 2012 May 16;13:99. doi: 10.1186/1471-2105-13-99. BMC Bioinformatics. 2012. PMID: 22591066 Free PMC article.
References
-
- Blank LM, Lehmbeck F, Sauer U. Metabolic-flux and network analysis in fourteen hemiascomycetous yeasts. FEMS Yeast Research. 2005;5:545–558. - PubMed
Publication types
MeSH terms
LinkOut - more resources
Full Text Sources
Other Literature Sources
