

13C-metabolic flux ratio and novel carbon path analyses confirmed that Trichoderma reesei uses primarily the respirative pathway also on the preferred carbon source glucose
- PMID: 19874611
- PMCID: PMC2776023
- DOI: 10.1186/1752-0509-3-104
13C-metabolic flux ratio and novel carbon path analyses confirmed that Trichoderma reesei uses primarily the respirative pathway also on the preferred carbon source glucose
Abstract
Background: The filamentous fungus Trichoderma reesei is an important host organism for industrial enzyme production. It is adapted to nutrient poor environments where it is capable of producing large amounts of hydrolytic enzymes. In its natural environment T. reesei is expected to benefit from high energy yield from utilization of respirative metabolic pathway. However, T. reesei lacks metabolic pathway reconstructions and the utilization of the respirative pathway has not been investigated on the level of in vivo fluxes.
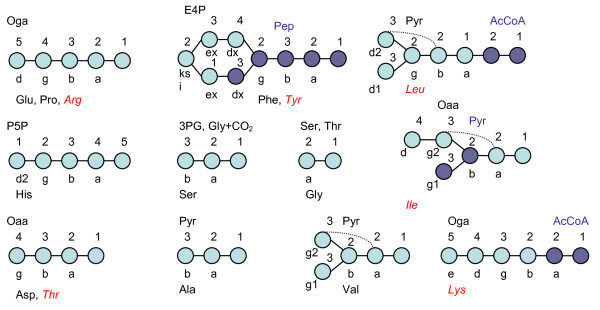
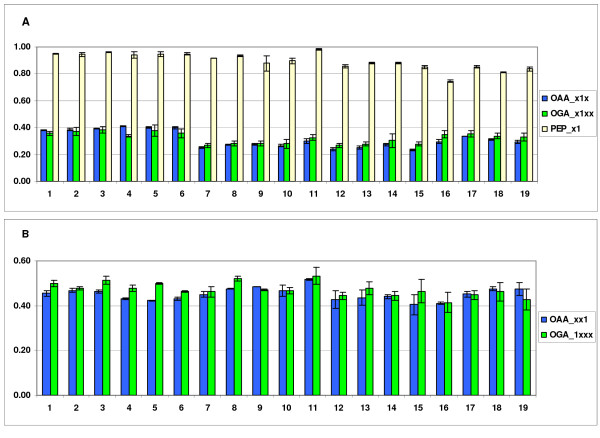
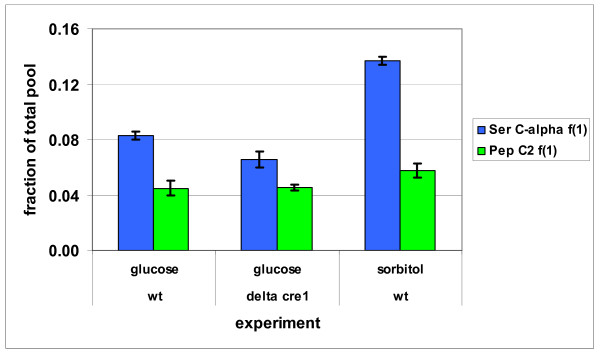
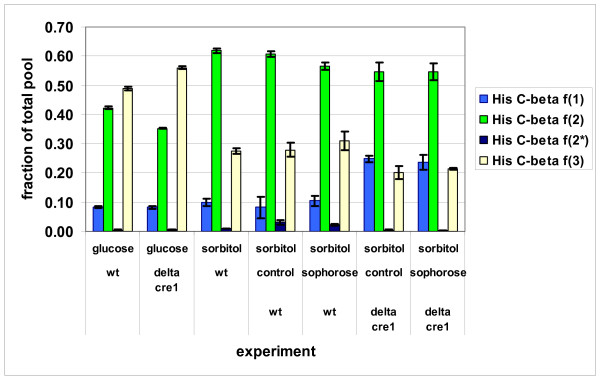
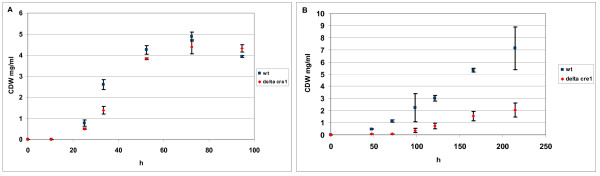
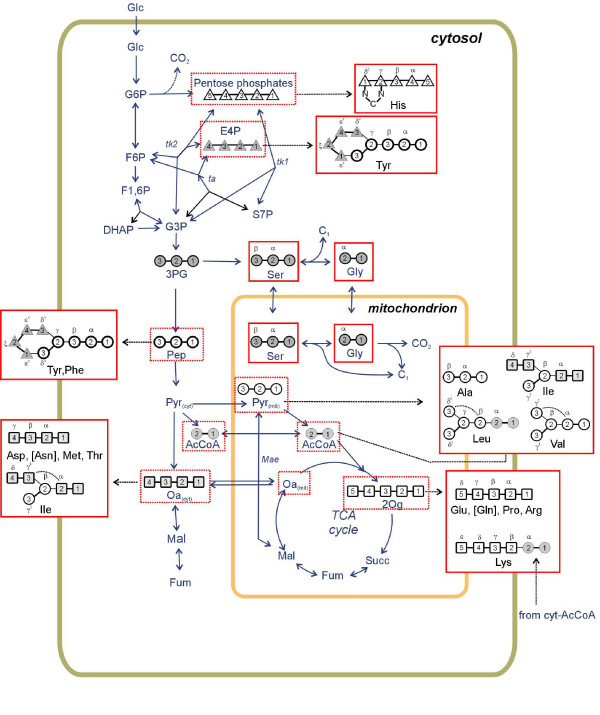
Results: The biosynthetic pathways of amino acids in T. reesei supported by genome-level evidence were reconstructed with computational carbon path analysis. The pathway reconstructions were a prerequisite for analysis of in vivo fluxes. The distribution of in vivo fluxes in both wild type strain and cre1, a key regulator of carbon catabolite repression, deletion strain were quantitatively studied by performing 13C-labeling on both repressive carbon source glucose and non-repressive carbon source sorbitol. In addition, the 13C-labeling on sorbitol was performed both in the presence and absence of sophorose that induces the expression of cellulase genes. Carbon path analyses and the 13C-labeling patterns of proteinogenic amino acids indicated high similarity between biosynthetic pathways of amino acids in T. reesei and yeast Saccharomyces cerevisiae. In contrast to S. cerevisiae, however, mitochondrial rather than cytosolic biosynthesis of Asp was observed under all studied conditions. The relative anaplerotic flux to the TCA cycle was low and thus characteristic to respiratory metabolism in both strains and independent of the carbon source. Only minor differences were observed in the flux distributions of the wild type and cre1 deletion strain. Furthermore, the induction of the hydrolytic gene expression did not show altered flux distributions and did not affect the relative amino acid requirements or relative anabolic and respirative activities of the TCA cycle.
Conclusion: High similarity between the biosynthetic pathways of amino acids in T. reesei and yeast S. cerevisiae was concluded. In vivo flux distributions confirmed that T. reesei uses primarily the respirative pathway also when growing on the repressive carbon source glucose in contrast to Saccharomyces cerevisiae, which substantially diminishes the respirative pathway flux under glucose repression.
Figures
Similar articles
-
Oxygen dependence of metabolic fluxes and energy generation of Saccharomyces cerevisiae CEN.PK113-1A.BMC Syst Biol. 2008 Jul 9;2:60. doi: 10.1186/1752-0509-2-60. BMC Syst Biol. 2008. PMID: 18613954 Free PMC article.
-
Trichoderma reesei CRE1-mediated Carbon Catabolite Repression in Re-sponse to Sophorose Through RNA Sequencing Analysis.Curr Genomics. 2016 Apr;17(2):119-31. doi: 10.2174/1389202917666151116212901. Curr Genomics. 2016. PMID: 27226768 Free PMC article.
-
Defining the genome-wide role of CRE1 during carbon catabolite repression in Trichoderma reesei using RNA-Seq analysis.Fungal Genet Biol. 2014 Dec;73:93-103. doi: 10.1016/j.fgb.2014.10.009. Epub 2014 Oct 18. Fungal Genet Biol. 2014. PMID: 25459535
-
Deciphering the molecular mechanisms behind cellulase production in Trichoderma reesei, the hyper-cellulolytic filamentous fungus.Biosci Biotechnol Biochem. 2016 Sep;80(9):1712-29. doi: 10.1080/09168451.2016.1171701. Epub 2016 Apr 14. Biosci Biotechnol Biochem. 2016. PMID: 27075508 Review.
-
From genomes to systems: the path with yeast.Philos Trans R Soc Lond B Biol Sci. 2006 Mar 29;361(1467):477-82. doi: 10.1098/rstb.2005.1805. Philos Trans R Soc Lond B Biol Sci. 2006. PMID: 16524836 Free PMC article. Review.
Cited by
-
Compartmentation of glycogen metabolism revealed from 13C isotopologue distributions.BMC Syst Biol. 2011 Oct 28;5:175. doi: 10.1186/1752-0509-5-175. BMC Syst Biol. 2011. PMID: 22034837 Free PMC article.
-
Assessing the intracellular primary metabolic profile of Trichoderma reesei and Aspergillus niger grown on different carbon sources.Front Fungal Biol. 2022 Sep 27;3:998361. doi: 10.3389/ffunb.2022.998361. eCollection 2022. Front Fungal Biol. 2022. PMID: 37746225 Free PMC article.
-
Finding metabolic pathways using atom tracking.Bioinformatics. 2010 Jun 15;26(12):1548-55. doi: 10.1093/bioinformatics/btq223. Epub 2010 Apr 25. Bioinformatics. 2010. PMID: 20421197 Free PMC article.
-
Enhancement of iminosugar production, 1-deoxynojirimycin and 1-deoxymannojirimycin, in recombinant Corynebacterium glutamicum.Food Sci Biotechnol. 2025 Feb 15;34(10):2225-2235. doi: 10.1007/s10068-025-01834-x. eCollection 2025 Jun. Food Sci Biotechnol. 2025. PMID: 40351729
-
Inferring branching pathways in genome-scale metabolic networks.BMC Syst Biol. 2009 Oct 29;3:103. doi: 10.1186/1752-0509-3-103. BMC Syst Biol. 2009. PMID: 19874610 Free PMC article.
References
-
- Kumar R, Singh S, Singh OV. Bioconversion of lignocellulosic biomass: biochemical and molecular perspectives. J Ind Microbiol Biotechnol. 2008;35:377–391. - PubMed
-
- Ilmén M. PhD thesis. VTT Publications VTT Espoo; 1997. Molecular mechanisms of glucose repression in the filamentous fungus Trichoderma reesei.
-
- Aro N, Pakula T, Penttilä M. Transcriptional regulation of plant cell wall degradation by filamentous fungi. FEMS Microbiol Rev. 2005;29:719–735. - PubMed
-
- Stricker AR, Mach RL, de Graaf LH. Regulation of transcription of cellulases- and hemicellulases-encoding genes in Aspergillus niger and Hypocrea jecorina (Trichoderma reesei) Appl Microbiol Biotechnol. 2008;78:211–220. - PubMed
-
- Margolles-Clark M, Ilmén M, Penttilä M. Expression patterns of ten hemicellulase genes from filamentous fungus Trichoderma reesei on various carbon sources. J Biotechnol. 1997;57:167–179.
Publication types
MeSH terms
Substances
LinkOut - more resources
Full Text Sources
