. 2009 Oct 29;64(2):173-87.
doi: 10.1016/j.neuron.2009.08.018.

SUN1/2 and Syne/Nesprin-1/2 complexes connect centrosome to the nucleus during neurogenesis and neuronal migration in mice

Affiliations

SUN1/2 and Syne/Nesprin-1/2 complexes connect centrosome to the nucleus during neurogenesis and neuronal migration in mice

Xiaochang Zhang et al. Neuron. .

Abstract

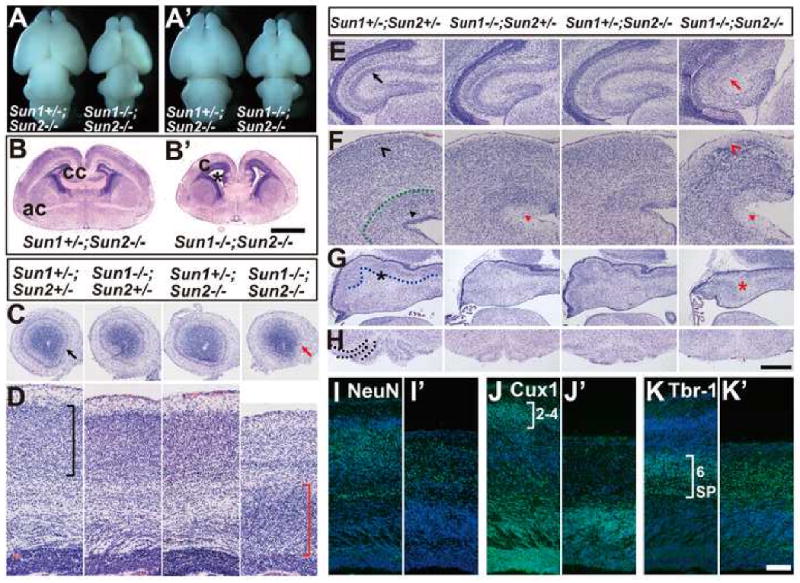
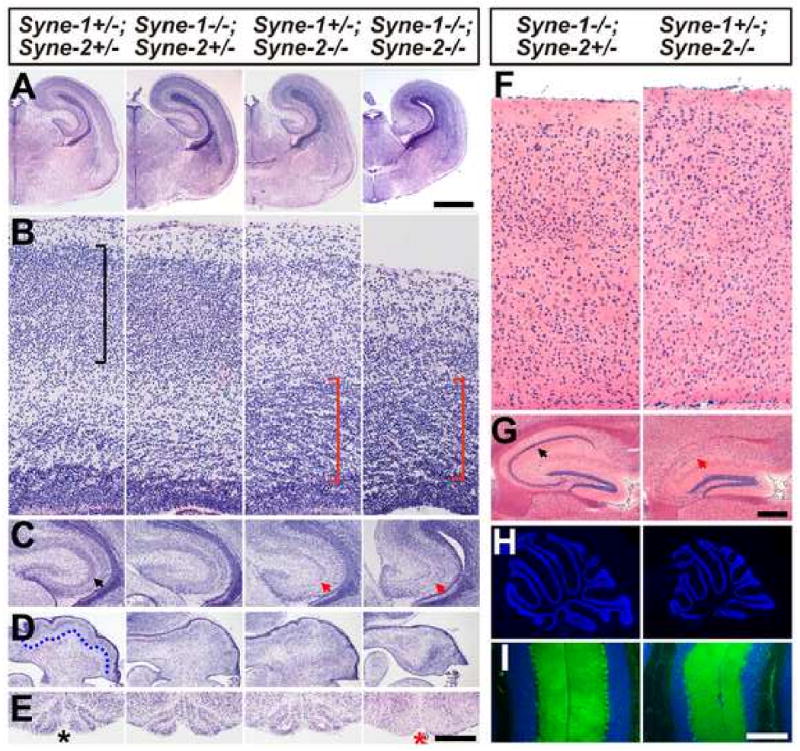
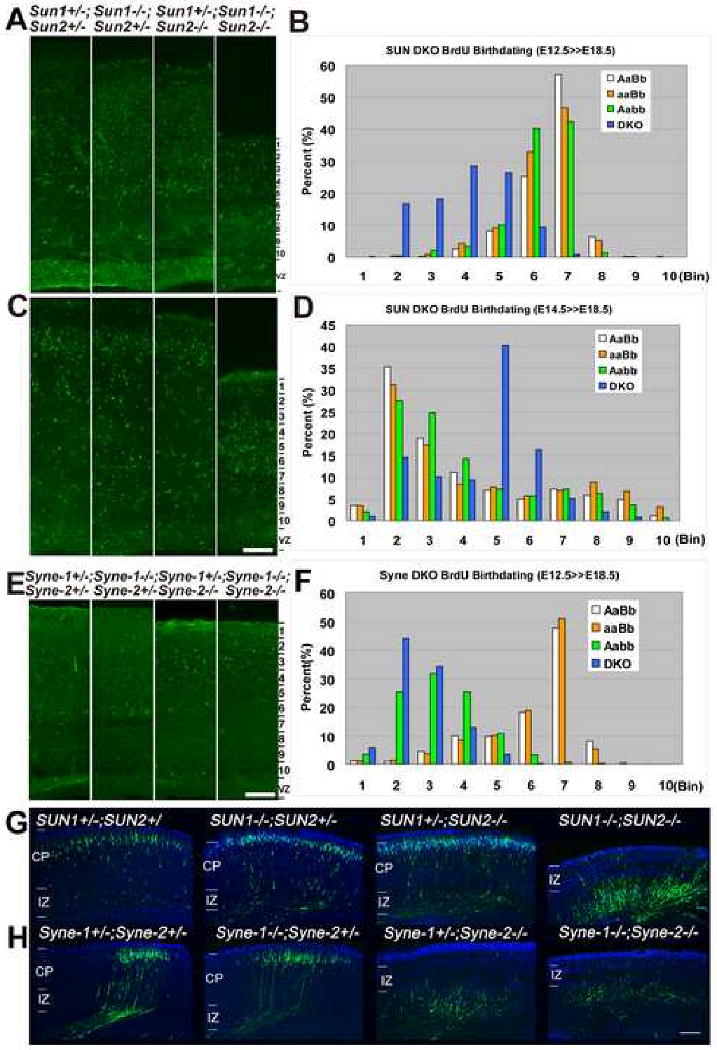
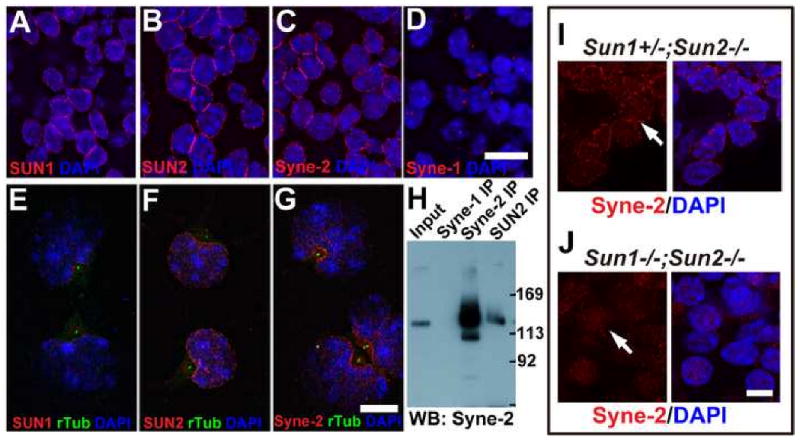
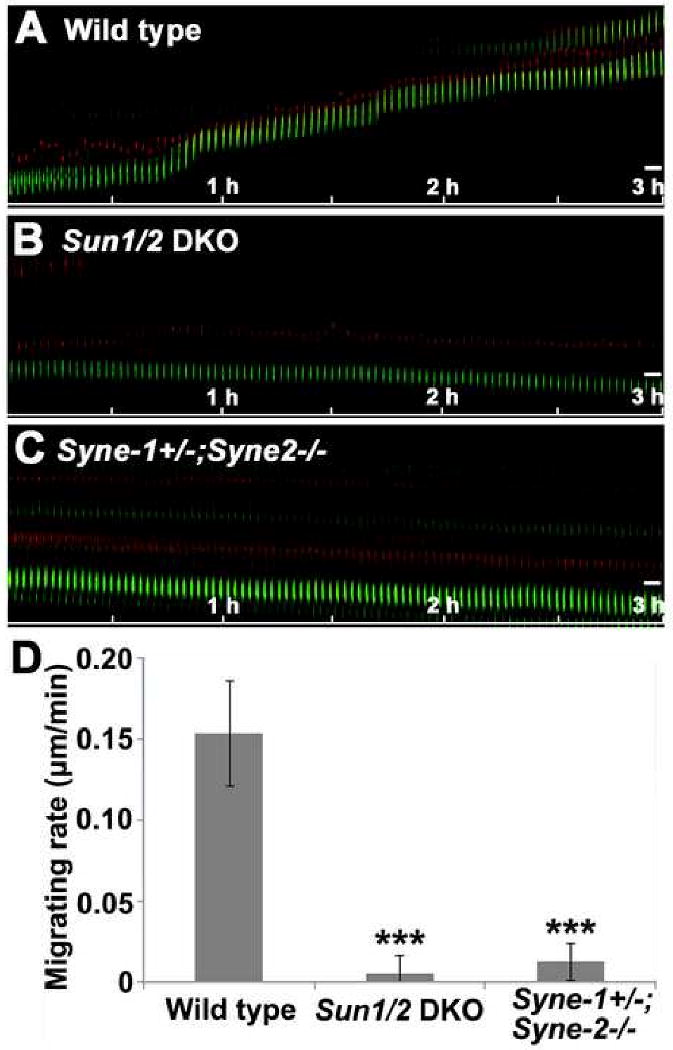
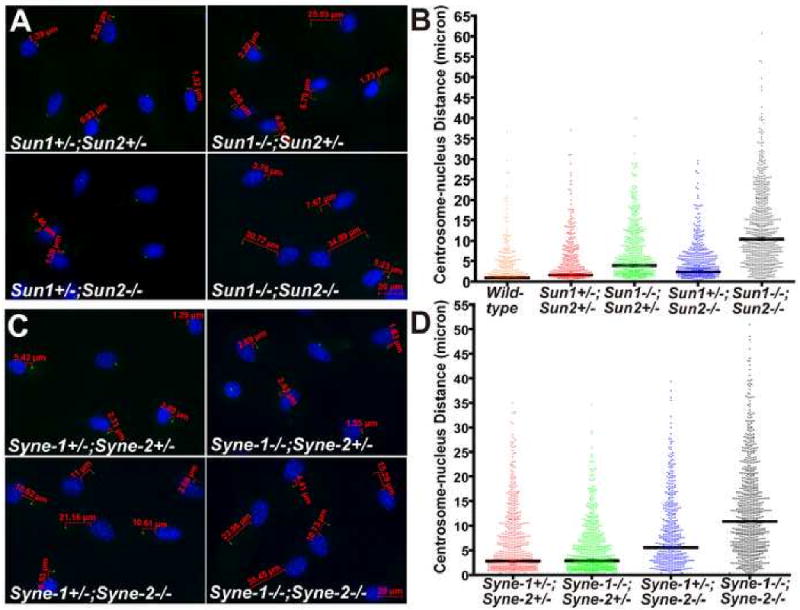
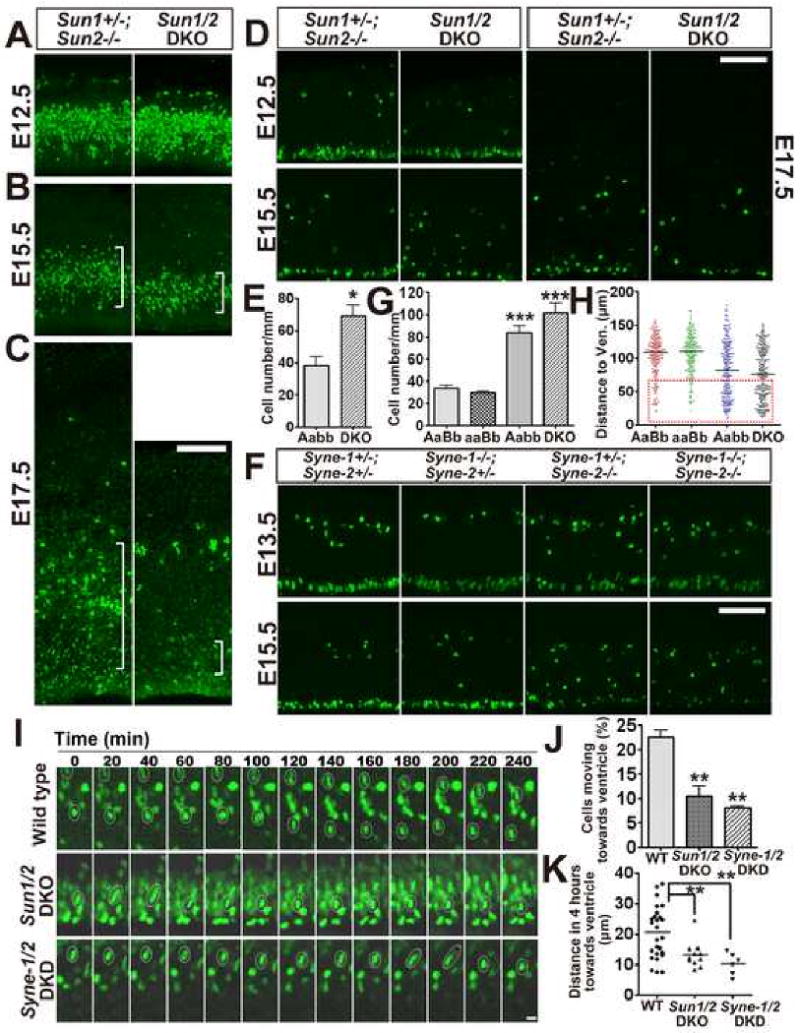
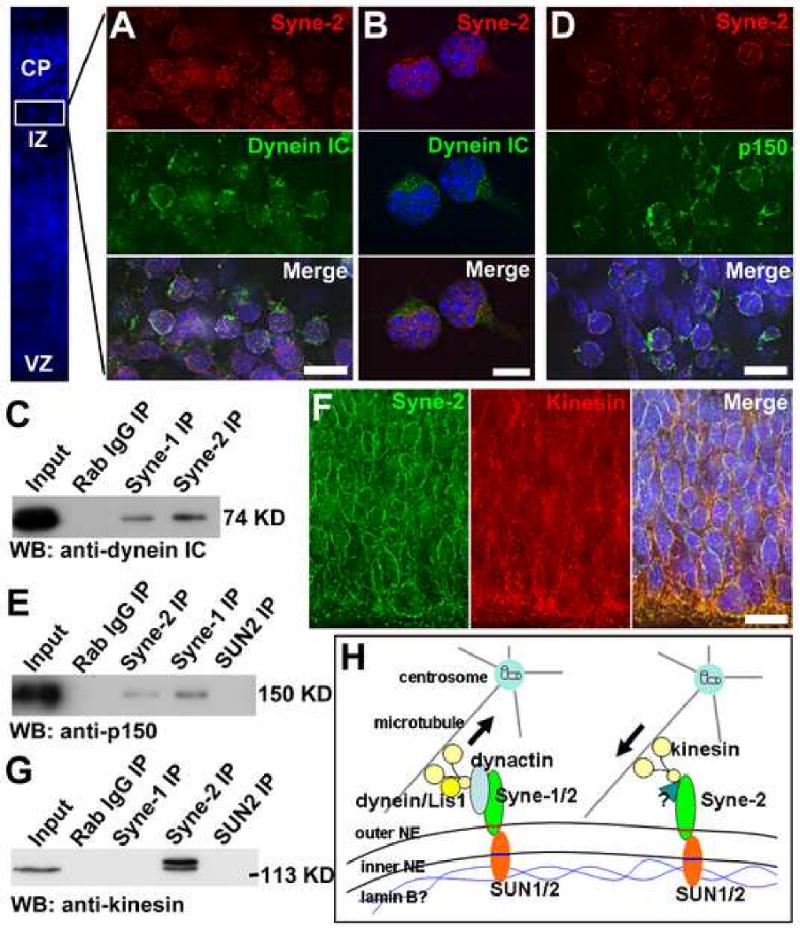
Nuclear movement is critical during neurogenesis and neuronal migration, which are fundamental for mammalian brain development. Although dynein, Lis1, and other cytoplasmic proteins are known for their roles in connecting microtubules to the nucleus during interkinetic nuclear migration (INM) and nucleokinesis, the factors connecting dynein/Lis1 to the nuclear envelope (NE) remain to be determined. We report here that the SUN-domain proteins SUN1 and SUN2 and the KASH-domain proteins Syne-1/Nesprin-1 and Syne-2/Nesprin-2 play critical roles in neurogenesis and neuronal migration in mice. We show that SUN1 and SUN2 redundantly form complexes with Syne-2 to mediate the centrosome-nucleus coupling during both INM and radial neuronal migration in the cerebral cortex. Syne-2 is connected to the centrosome through interactions with both dynein/dynactin and kinesin complexes. Syne-2 mutants also display severe defects in learning and memory. These results fill an important gap in our understanding of the mechanism of nuclear movement during brain development.


Figures

Figure 1
Figure 1. Brains of Sun1/2 DKO embryos display severe laminary defects and inverted layers in multiple brain regions
(A-A′) Dorsal (A) and ventral (A′) views of E18.5 brains. The brains of Sun1/2 DKO embryos were significantly smaller than that of their littermates. (B-B′) Coronal sections of E18.5 brains at anterior commissure (ac) stained with H&E. Compared to the Sun1+/-; Sun2-/- control, the Sun1/2 DKO brain displayed smaller size, significantly enlarged lateral ventricles (asterisk) and abnormal cortical structures (c). cc, corpus callosum. Bar, 1000μm. (C-H) Coronal sections of E18.5 brains stained with H&E, showing defects in various regions of Sun1/2 DKO brains compared to their littermates. (C) Mitral cell layer was missing in olfactory bulb in the DKO brain (red arrow). (D) Neocortex of the DKO embryo displayed inverted layers (red bracket) compared to the controls (black bracket). (E) Pyramidal cell layer was disrupted in the DKO hippocampus (red arrow). (F) Laminary defects in the DKO midbrain are shown (red arrowheads). (G) Purkinje cell layer (highlighted by a dotted line in the control) was malformed in the DKO cerebellum. (H) The inferior olive (highlighted by dotted lines in the control) was lost in the DKO brain stem. Bar in (H) equals 475μm for (C), 159μm for (D), 365μm for (E), 266μm for (F), and 500μm for (G-H). (I-K) Coronal sections of E18.5 brains stained with different markers. (I) NeuN staining revealed that the number of cortical neurons (green) was decreased and the sub-plate was poorly formed in Sun1/2 DKO brain (I′), compared to that of Sun1+/-; Sun2-/- control (I). (J-K) Cux-1 and Tbr-1 positive neurons (green) in Sun1/2 DKO brain (J′ and K′) occupied inverted positions compared to that in Sun1+/-; Sun2-/- control (J and K). SP, subplate. Bar, 100 μm.
Figure 2
Figure 2. Brains of Syne-1/2 DKD mice phenocopy Sun1/2 DKO mutants
(A-E) Coronal sections of E18.5 brains stained with H&E, showing defects in various regions of the Syne-1-/-; Syne-2-/- brains compared to that of their littermates. (A) Syne-1-/-; Syne-2-/- brain displayed smaller size and enlarged cerebral ventricles. Bar, 1000μm. (B) Both Syne-1+/-; Syne-2-/- and Syne-1-/-; Syne-2-/- brains displayed inverted layers in the cerebral cortex (red brackets). (C) The pyramidal cell layers were malformed in Syne-1+/-; Syne-2-/- and Syne-1-/-; Syne-2-/- hippocampus (red arrows). (D) The Purkinje cell layer (highlighted by a dotted line in a control) was disrupted in Syne-1-/-; Syne-2-/-cerebellum. (E) The inferior olive clearly seen in the controls (asterisk) was missing in Syne-1/2 DKD brain stem (red asterisk). Bar in (E) equals 120μm in (B), 487μm in (C), 635μm in (D) and 500μm in (E). (F-G) Coronal sections of adult brain stained with H&E. (F) The distinct 6-layer structure could be easily observed in Syne-1-/-; Syne-2+/- neocortex, but was disrupted in Syne-1+/-; Syne-2-/- brain. (G) The pyramidal cell layer seen in controls was severely disrupted in Syne-1+/-; Syne-2-/- hippocampus (red arrow). Bar in (G) equals 60μm in (F) and 250μm in (G) (H-I) Sagittal sections of adult cerebellums stained with DAPI (blue) and anti-Calbindin antibody (green). (H)The cerebellum of Syne-1+/-; Syne-2-/- mouse displayed a smaller size but normal foliations compared to the control. (I) In the cerebellum of Syne-1+/-; Syne-2-/- mouse, the inner granule cell layer (IGL, blue) is significantly thinner than that of the control, but the Purkinje cells occupied correct positions (green dots lining the IGL). Bar in (I) equals 265μm in (H) and 200μm in (I).
Figure 3
Figure 3. Loss of SUN1/2 or Syne-2 disrupts radial neuronal migration in the cerebral cortex
(A-D) BrdU birth-dating assays from E12.5 to E18.5 in Sun1/2 DKO mice. (A) E12.5 labeled BrdU positive cells (green) in Sun1/2 DKO brain were randomly distributed in the cortex (coronal section), while the BrdU positive cells in controls were localized deep in the cortex along the intermediate zone. (C) E14.5 labeled BrdU positive cells were localized deep in the Sun1/2 DKO cortex while most BrdU positive cells in controls were localized in layer 2-3. Bar in (C) equals 100μm for (A)&(C). (B)&(D) The region between pial surface and the VZ was arbitrarily divided into ten bins, and cell numbers in each bin were calculated. Statistical analysis showing the inverted distribution of BrdU positive cells between Sun1/2 DKO (DKO) brain and controls. More than three mice for each genotype and more than 4 sections were analyzed for each brain. AaBb, Sun1+/-; Sun2+/-. aaBb, Sun1-/-; Sun2+/-. Aabb, Sun1+/-; Sun2-/-. (E-F) BrdU birth-dating assays from E12.5 to E18.5 in Syne-1/2 DKD mice. E12.5 born neurons occupied inverted position in the cortex of Syne-1+/-; Syne-2-/- (Aabb) and Syne-1/2 DKD (DKO) embryos compared to that in the Syne-1+/-; Syne-2+/- (AaBb) and Syne-1-/-; Syne-2+/- (aaBb) controls. Bar, 100μm. (G-H) Coronal sections of E18.5 brains showing EYFP positive cells labeled by EYFP-expressing plasmids at E14.5. (G) The EYFP positive cells failed to migrate to layer2-3 in Sun1/2 DKO brain compared to those in controls. (H) The EYFP positive cells in Syne-1+/-; Syne-2-/- and Syne-1/2 DKD embryos failed to migrate to layer2-3 compared to those in the controls. CP, cortical plate. IZ, intermediate zone. Bar, 252μm.
Figure 4
Figure 4. SUN1 and SUN2 are required for the NE localization of Syne-2
(A-D) Coronal sections of E15.5 wild-type mouse brain stained with antibodies against indicated proteins. SUN1, SUN2 and Syne-2 were localized on the nuclear envelope (NE), and Syne-1 showed bright dots adjacent to the nuclei. Bar, 10μm. The NE localization of these three proteins in brain neurons were confirmed by their co-localization with lamin B (Figure S6). (E-G) Immuno-staining images of primary cultured E15.5 neurons showing high levels of SUN1, SUN2 and Syne-2 signals (red) at the NE region facing the centrosome (green dots, anti-γ-tubulin antibody staining). Bar, 10μm. (H) Western blot showing interaction between Syne-2 and SUN2. E17.5 brain lysates were immuno-precipitated with antibodies against Syne-1, Syne-2 and SUN2 (rabbit polyclonal), and immunoblotted with anti-Syne-2 (mouse monoclonal). The two bands of Syne-2 in the input also exist in the anti-Syne-2 and anti-SUN2 immunoprecipitates. (I-J) Immuno-staining images showing that the NE localization of Syne-2 (red) in E15.5 cortex was disturbed in Sun1/2 DKO brain. Bar, 5μm.
Figure 5
Figure 5. Loss of SUN1/2 or Syne-2 disrupts nucleokinesis during radial neuronal migration
(A-C) Kymographs showing the movement of centrosomes (red) and nuclei (green) on live brain slices. The saltatory movement seen in the wild-type control (A) was disrupted in Sun1/2 DKO (B) and Syne-1+/-; Syne-2-/- brains (C). Bar, 5μm. (D) Statistical data showing the migration rate of nuclei of brain cells of indicated genotypes. The nuclei in Sun1/2 DKO and Syne-1+/-; Syne-2-/- mice migrate drastically slower than those in the wild-type controls. n>16, p<0.001.
Figure 6
Figure 6. The centrosome-nucleus coupling is disrupted in Sun1/2 DKO and Syne-1/2 DKD glia
(A-B) Glial cells were stained with DAPI (blue) and anti-γ-tubulin antibody (green). The distance between the nucleus and the centrosome was measured using AxioVision (Carl Zeiss Microimaging, Inc). The centrosome-nucleus distance in Sun1/2 DKO glia was dramatically increased and randomized compared to the controls (B). (C-D) The centrosome-nucleus distance was significantly increased in Syne-1+/-; Syne-2-/- glial cells, and the defect was exacerbated in Syne-1/2 DKD cells. Over 400 cells were scored for each genotype, and the p-values are shown in the two tables below.
Figure 7
Figure 7. Loss of SUN1/2 or Syne-2 disrupts interkinetic nuclear migration and leads to progressive depletion of neural progenitors
(A-C) Fluorescence images showing proliferating cells pulse labeled with BrdU at E12.5, E15.5 and E17.5 (green). The number of proliferating cells in Sun1/2 DKO brain was progressively decreased compared to the controls. Noticeably, the BrdU positive cells at the IZ (white brackets) of E17.5 Sun1/2 DKO brain were essentially missing compared to that of control brain. Bar, 100 μm. (D) Immuno-staining images showing phosphorylated-Histone3 (pH3, S10P) positive cells (green) identified at different time points in the ventricular zone (VZ). In Sun1/2 DKO mice, a significant portion of mitotic cells in the VZ was mis-positioned at E15.5 and the total number of mitotic cells at the apical surface was decreased at E17.5. Bar, 100 μm. (E) Statistical diagrams illustrating mis-positioning of mitotic cells in the VZ of Sun1/2 DKO brains. The average number of mis-positioned pH3 positive cells per 1000 micrometers was analyzed at E15.5, and the number was significantly increased in Sun1/2 DKO brain (DKO). n=3, p<0.05. Aabb, Sun1+/-; Sun2-/-. (F) Images showing that mitotic cells (green, pH3 positive) in the VZ were dramatically mis-positioned and the number of mitotic cells along the apical surface was significantly decreased in Syne-1+/-; Syne-2-/- and Syne-1/2 DKD brain at E15.5 compared to controls. Bar, 100 μm. (G-H) Statistical diagrams illustrating mis-positioning of mitotic cells in the VZ of Syne-2-/-brains. (G)Average number of mis-positioned mitotic cells in the VZ was significantly increased in Syne-1+/-; Syne-2-/- (Aabb) and Syne-1/2 DKD (aabb) brains at E15.5 (2 mice for each genotype and over ten sections of each mice were examined, p<0.001 when either Aabb or aabb group was compared with control ones). (H) Y axis represents the distance between the mis-positioned pH3 positive cell and the apical surface of the VZ. 200 cells were counted for each genotype, with obviously more cells were severely mis-positioned in Syne-1/2 DKD brain (red dotted box). AaBb, Syne-1+/-; Syne-2+/-; aaBb, Syne-1-/-; Syne-2+/-. (I) Time-lapse recording of live brain slices at the VZ showing the movement of soma/nucleus (green). The movement of soma toward the apical surface of the VZ was disrupted in Sun1/2 DKO and Syne-1/2 DKD mice (white circles). Bar, 10 μm. (J) Bar diagram showing that less than 10% of cells were migrating toward the apical surface of the VZ in Sun1/2 DKO and Syne-1/2 DKD mice, compared to 22.5 % in wild-type mouse brain. (K) Diagram illustrating the distance an individual nucleus moved toward the apical surface of the VZ within 4 hours. This average distance was significantly decreased in Sun1/2 DKO and Syne-1/2 DKD mouse brain. 2 slices for wild type and Syne-1/2 DKD, and 3 slices for Sun1/2 DKO mouse brains.
Figure 8
Figure 8. Syne-2 interacts with the dynein/dynactin complex at the nuclear envelope
(A-B) Immuno-staining images showing that Syne-2 and dynein intermediate chain (IC) co-localize on the NE of E15.5 mouse cortical cells (A) and primary cultured cortical neurons (B). Bar, 10 μm. (C) Western blot showing antibodies against Syne-1 and Syne-2 precipitated dynein IC from E17.5 brain lysates. (D) Immuno-staining images showing that Syne-2 and dynactin (p150) co-localized on the NE of E15.5 mouse cortex. Bar, 10 μm. (E) Western blot showing that antibodies against Syne-1 and Syne-2 precipitated the p150 subunit of dynactin. (F) Immuno-staining images showing that kinesin and Syne-2 partially co-localize on the NE in the VZ of E13.5 mouse brain. Bar, 10 μm. (G) Western blot showing that kinesin was precipitated from E17.5 brain lysate by anti-Syne-2 antibody. (H) A model illustrating how SUN1/2 and Syne-1/2 mediate the driving force from microtubule to the nucleus. Inner nuclear envelope proteins SUN1/2 interact with Lamin B and form complexes with the outer NE proteins Syne-1 and Syne-2. During INM at G2 phase and nucleokinesis, Syne-1 and Syne-2 interact with cytoplasmic dynein/Lis1 complexes to pull the nucleus toward the centrosome. During INM at G1 phase, Syne-2 forms complexes with kinesin to push the nucleus away from the centrosome.
Figure 9
Figure 9. Loss of KASH-domain containing Syne-2 disrupts working memory in mice
(A) Bar diagram showing the defect of Syne-2-/- mice in a rewarded T-maze alternation assay. Syne-2-/- mice showed significantly worse performance than their littermate controls. Syne-2+/- n=15, Syne-2-/- n=12. (B) Diagram showing the results of an open-field assay, indicating that both female and male Syne-2-/- mice entered significantly more grids than controls in an open field.

Comment in

References

    1. Chae T, Kwon YT, Bronson R, Dikkes P, Li E, Tsai LH. Mice lacking p35, a neuronal specific activator of Cdk5, display cortical lamination defects, seizures, and adult lethality. Neuron. 1997;18:29–42. - PubMed
    1. Chen G, Sima J, Jin M, Wang KY, Xue XJ, Zheng W, Ding YQ, Yuan XB. Semaphorin-3A guides radial migration of cortical neurons during development. Nat Neurosci. 2008;11:36–44. - PubMed
    1. Chi YH, Cheng LI, Myers T, Ward JM, Williams E, Su Q, Faucette L, Wang JY, Jeang KT. Requirement for Sun1 in the expression of meiotic reproductive genes and piRNA. Development. 2009;136:965–973. - PMC - PubMed
    1. Crisp M, Liu Q, Roux K, Rattner JB, Shanahan C, Burke B, Stahl PD, Hodzic D. Coupling of the nucleus and cytoplasm: role of the LINC complex. J Cell Biol. 2006;172:41–53. - PMC - PubMed
    1. D'Arcangelo G, Miao GG, Chen SC, Soares HD, Morgan JI, Curran T. A protein related to extracellular matrix proteins deleted in the mouse mutant reeler. Nature. 1995;374:719–723. - PubMed

Publication types

MeSH terms