Review
. 2010 Jan;31(1):24-33.
doi: 10.3174/ajnr.A1790. Epub 2009 Oct 29.

Hyperpolarized MR imaging: neurologic applications of hyperpolarized metabolism

Affiliations
Review

Hyperpolarized MR imaging: neurologic applications of hyperpolarized metabolism

B D Ross et al. AJNR Am J Neuroradiol. 2010 Jan.

Abstract

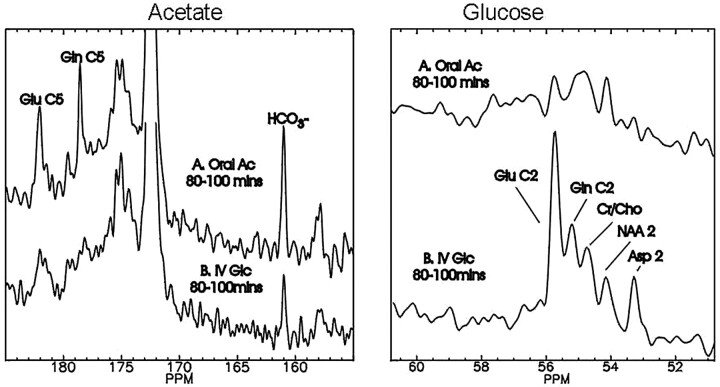
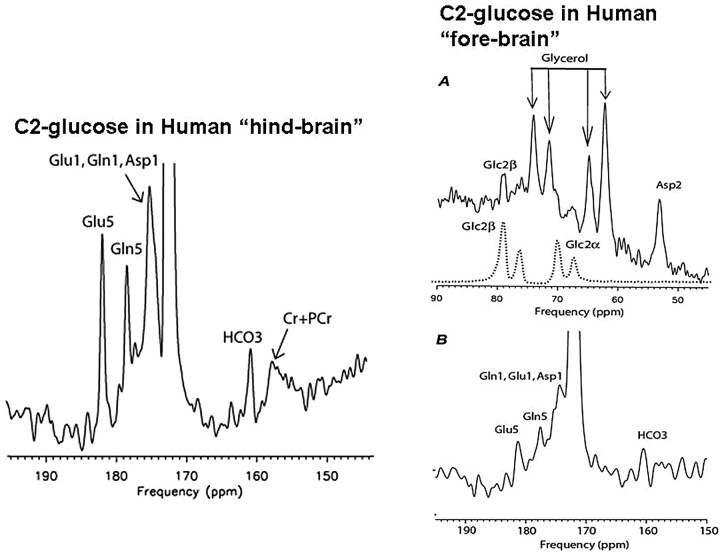
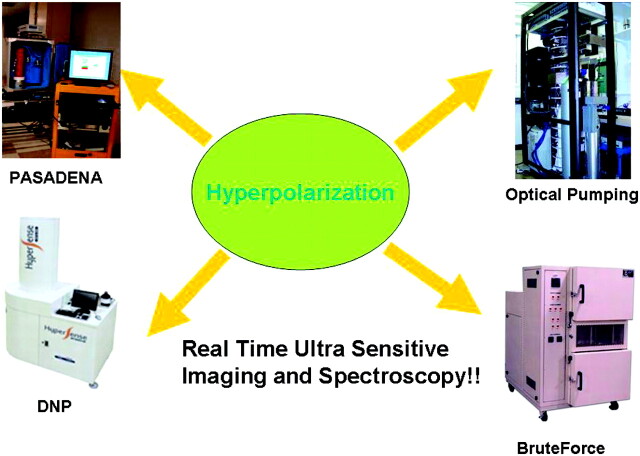
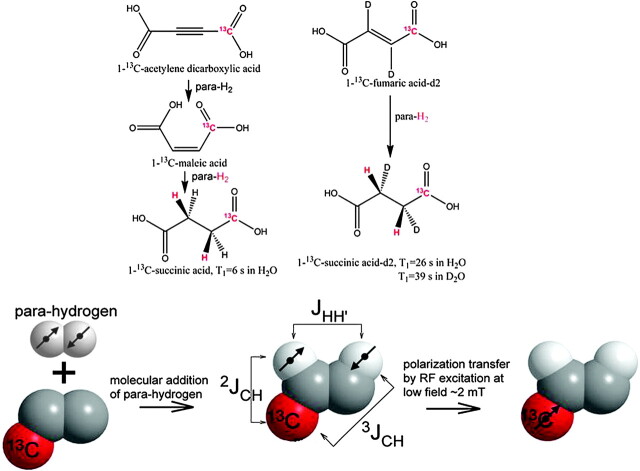
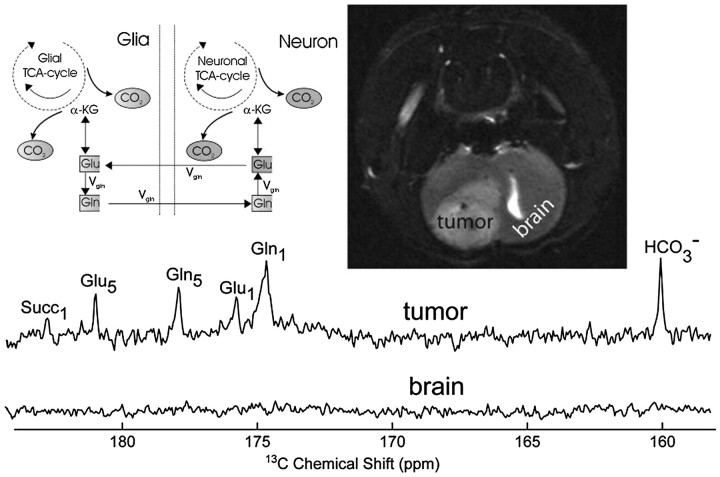
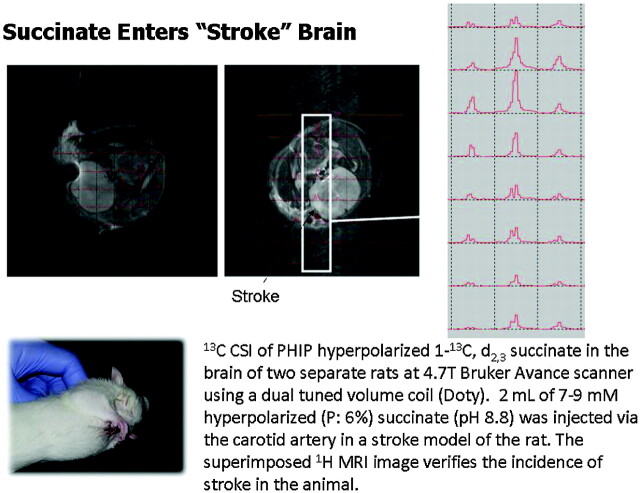
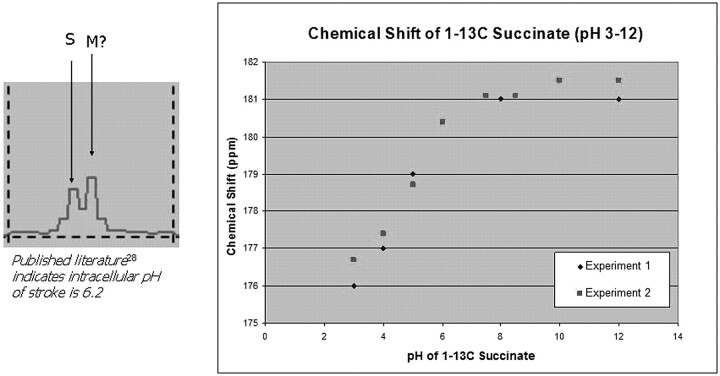
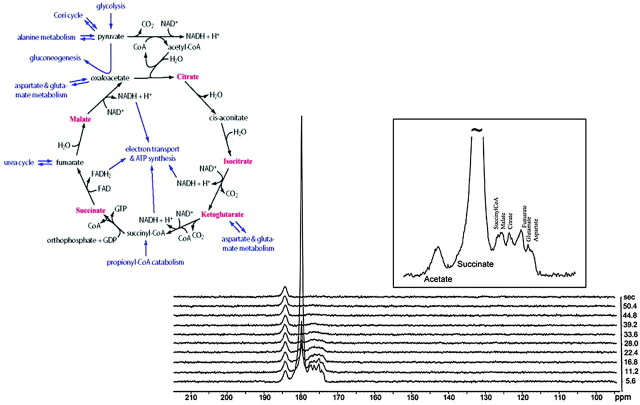
Hyperpolarization is the general term for a method of enhancing the spin-polarization difference of populations of nuclei in a magnetic field. No less than 5 distinct techniques (dynamic nuclear polarization [DNP]; parahydrogen-induced polarization-parahydrogen and synthesis allow dramatically enhanced nuclear alignment [PHIP-PASADENA]; xenon/helium polarization transfer; Brute Force; (1)H hyperpolarized water) are currently under exhaustive investigation as means of amplifying the intrinsically (a few parts per million) weak signal intensity used in conventional MR neuroimaging and spectroscopy. HD-MR imaging in vivo is a metabolic imaging tool causing much of the interest in HD-MR imaging. The most successful to date has been DNP, in which carbon-13 ((13)C) pyruvic acid has shown many. PHIP-PASADENA with (13)C succinate has shown HD-MR metabolism in vivo in tumor-bearing mice of several types, entering the Krebs-tricarboxylic acid cycle for ultrafast detection with (13)C MR imaging, MR spectroscopy, and chemical shift imaging. We will discuss 5 promising preclinical studies: (13)C succinate PHIP in brain tumor; (13)C ethylpyruvate DNP and (13)C acetate; DNP in rodent brain; (13)C succinate PHIP versus gadolinium imaging of stroke; and (1)H hyperpolarized imaging. Recent developments in clinical (13)C neurospectroscopy encourage us to overcome the remaining barriers to clinical HD-MR imaging.


Figures

Fig 1.
Fig 1.
Enhanced neuronal contrast through selective 13C enrichment. With noninvasive 13C MR spectroscopy, it is possible to separately evaluate glial metabolism by use of the precursor 1-13C acetate (left panel), which is selectively transported into astrocytes and metabolized to glutamate (Glu) and glutamine (Gln) enriched in carbon 5 (C5). Neuronal metabolism favors 13C glucose (GLc, right panel), which is also converted to glutamate and glutamine, enriched in carbon 2 (C2), as well as carbons 3 and 4 (C4) (not shown). Both acetate and glucose are metabolized to 13C bicarbonate (HCO3, left panel), respectively quantifying glial and neuronal tricarboxylic acid (TCA) cycle rates of the intact human brain. Oral Ac indicates administered load of 1-13C enriched sodium acetate, followed 80-100 min later by enrichment of cerebral metabolites as indicated; mins, minutes; Gln, glutamine; Asp, aspartate; Cr, creatine; Cho, choline; NAA, N-acetylaspartate.
Fig 2.
Fig 2.
Moving to the frontal lobe through low-power 13C MR spectroscopy. Traditionally, in vivo 13C MR spectroscopy of the human brain has been confined to “safe” areas, such as the occipital cortex (left panel), to avoid heat deposition in the ocular lens. With increased interest in metabolic abnormalities of the frontal lobe involved in executive functions, a novel 13C MR spectroscopy method uses low-power nuclear Overhauser effect (NOE) to safely obtain glial metabolic data (right panel) from the frontal cortex. DC indicates (proton) decoupling. Reprinted with permission from Journal of Magnetic Resonance. Copyright 2008, Elsevier Ltd.
Fig 3.
Fig 3.
13C MR spectroscopy of neuronal function in the frontal brain. To obtain equivalent data concerning neuronal function, the isotope infused must be C2-enriched 13C glucose which, in contrast to carbon 1 (C1)-glucose, enriches glutamate and glutamine in C5 and C1 (left panel). These products can safely be measured with a low-power NOE method in the frontal lobes (right panel). PCr indicates phosphocreatine. Reproduced with permission from Radiology. Copyright 2009, Radiological Society of North America.
Fig 4.
Fig 4.
13C MR spectroscopy schematic for examining the “two-hit” hypothesis of drug abuse in the frontal brain. Combining dynamic 13C measures of glial and neuronal glutamate metabolism with 1H-MR spectroscopy assays of steady-state glutamate concentration provides a novel window on drug abuse. Inhibition of acetate metabolism by methamphetamine (Meth) abuse indicates a possible mechanism whereby reduced clearance of glutamate in glia (hit 1) results in glutamate excitotoxicity of neurons (hit 2). Variations on this theme may contribute to other neurologic syndromes for which selective assays of glial and neuronal function provide enhanced imaging tools. Na indicates sodium; ATPase, adenosine triphosphatase; K, potassium; EAAT, excitatory amino acid transporter. Reprinted with permission from Science. Copyright 1999, The American Association for the Advancement of Science.
Fig 5.
Fig 5.
Four methods for hyperpolarized-MR imaging and spectroscopy. In the historic order of discovery, parahydrogen-induced polarization (PASADENA); optical pumping of noble gases helium and xenon; dynamic nuclear polarization (DNP); and Brute Force have each been harnessed to the challenge of increasing enhancement above the Boltzmann distribution of approximately 1 ppm toward unity, with upwards of 10,000-fold enhancement of MR signal intensity for in vivo MR imaging and MR spectroscopy.
Fig 6.
Fig 6.
Two techniques for producing hyperpolarized 13C succinate, the first biologic imaging agent generated by the parahydrogen method. Starting with the toxic precursor acetylene dicarboxylic acid (left panel) or with the biologically safe 1-13C fumarate (right panel), a high degree of polarization can be achieved during the molecular addition of parahydrogen, followed by polarization transfer to the 13C atom shown in red (below). D indicates deuterium; d2, deuteration; RF, radio-frequency; mT, milli-Tesla; HO, hydroxyl; H, hydrogen; T, spin relaxation time (seconds); D2O, deuterized water; JHH, proton-carbon coupling constants; JCH, carbon-carbon coupling constants.
Fig 7.
Fig 7.
Quality assurance and reproducibility of hyperpolarization. A−C, The signal-intensity enhancement (19% polarization equivalent to 47,000-fold) due to hyperpolarization, estimated by comparison of the test reagent (A) with a standard solution of natural-abundance 13C ethanol (B ), while remarkably constant during 4 days and 16 successive in vitro experiments (C ), is more variable in vivo. The effects of dilution, mixing in blood, circulation times, T1 relaxation time of the 13C (and 15N) reagents, combined with the effects of radio-frequency pulses used for signal-intensity detection significantly reduce available signal-intensity enhancement in vivo. HMRI indicates Huntington Medical Research Institutes; P = polarization (%).
Fig 8.
Fig 8.
Real-time 13C PASADENA images of carotid artery and major blood vessels of the pig brain. Two of a time-lapse series of images obtained subsequent to a single injection of aqueous hydroxyethyl propionate (1, 13C) with initial polarization P = 0.4.
Fig 9.
Fig 9.
Toward hyperpolarized 13C succinate imaging of brain cancer. In this early study, 13C hyperpolarized images of the 9L brain tumor are obtained, but no metabolites are detected in vivo when hyperpolarized “succinate” (generated from 13C acetylene dicarboxylic acid; Fig 6, left) is injected via the jugular vein. Harvested brain tumor subsequently showed nonhyperpolarized 13C metabolites anticipated from metabolism of 13C succinate (Succ) through the neuronal and glial pathways indicated. No metabolites were isolated from the intact brain, indicating possibly the importance of a defective blood-brain barrier (BBB) for in vivo hyperpolarization neuroimaging. α-KG indicates alpha-ketoglutarate; Vgh, velocity glutamine-glutamate cycle. Reprinted with permission from Journal of Magnetic Resonance. Copyright 2007, Elsevier Ltd.
Fig 10.
Fig 10.
In vivo neuroimaging and spectroscopy of hyperpolarized 13C succinate. In confirmation of the role of BBB, the first truly in vivo hyperpolarized 13C spectra arose predominantly from the stroke region of rat brain (left and center) as shown in 2D ultrafast chemical shift imaging (CSI) series (right panel) (Avance, Bruker, Karlsruhe, Germany). PHIP indicates parahydrogen-induced polarization.
Fig 11.
Fig 11.
Hyperpolarized 13C metabolites of succinate in stroke brain. The effect of in vitro pH was verified on chemical shift of 13C succinate (right). A spectrum (inset) from the in vivo hyperpolarized dataset in Fig 10 indicates 2 resonances that are tentatively assigned to 13C succinate (S) at approximately pH 8 and its hyperpolarized metabolic product, C4 malate (M). The intracellular pH of stroke in vivo might, in the future, be estimated from hyperpolarized 13C spectra acquired in 3.5 seconds. Suc indicates succinate. (T. Tran and N. Sailasuta, unpublished data, HMRI, May 2009)
Fig 12.
Fig 12.
New directions for enhanced 13C imaging of brain cancer. Immunocytochemical stain for the hypoxia-induced factor (HIF)-1α indicates glioblastoma to be particularly rich in this cancer biomarker protein. This may, in the future, provide a uniquely sensitive means of in vivo imaging of brain cancer grade and metabolic activity (see Fig 13). RENCA, renal cancer; A-20-A (top left, top right, and bottom right ×160; bottom left ×312). (Courtesy of Dr. Ashraf Imam).
Fig 13.
Fig 13.
Hyperpolarized 13C succinate—a probe for the in vivo TCA cycle. Subcutaneous RENCA was used to demonstrate the potential for subsecond imaging of the Krebs (TCA) cycle in vivo. Not yet achieved in intact brain (see Fig 9), this novel means of enhancing metabolic images may be effective when used with short-term opening of the BBB. For abbreviations in this depiction of the Krebs tricarboxylic acid cycle, please see standard texts: metabolite peaks associated with those intermediates displayed in red were enriched in this model tumor and appear as hyperpolarized 13C resonances during the first 18 seconds after intravenous (IV) injection of 6 micromoles 13C succinate.

References

    1. Barker P. How to enhance your image. Advanced Imaging Seminar: Contrast Agents. Proc ASNR; 2009, Vancouver, Canada.
    1. Ross B, Lin A, Harris K, et al. . Clinical experience with 13C MRS in vivo. NMR Biomed 2003; 16: 358–69 - PubMed
    1. Sailasuta N, Robertson LW, Harris KC, et al. . Clinical NOE 13C MRS for neuropsychiatric disorders of the frontal lobe. J Magn Reson 2008; 195: 219–25. Epub 2008 Sep 17 - PMC - PubMed
    1. Gropman AL, Sailasuta N, Harris KC, et al. . Ornithine transcarbamylase deficiency with persistent abnormality in cerebral glutamate metabolism in adults. Radiology 2009; 252: 833–41 - PMC - PubMed
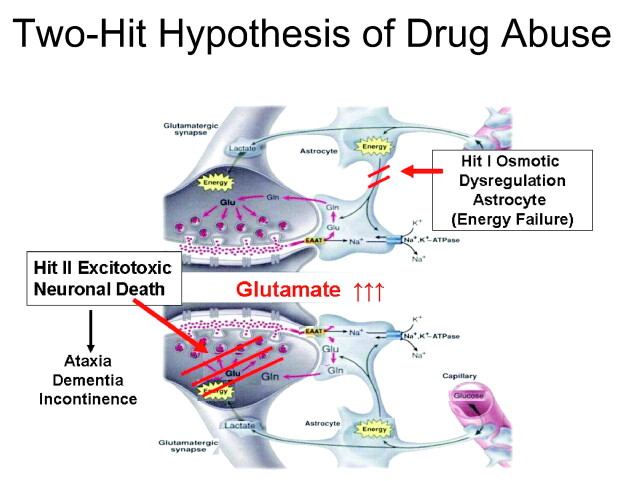
    1. Sailasuta N, Harris KC, Abulseoud O, et al. . 1-13C acetate MRS to study glial glutamate dysfunction in methamphetamine users. Proc Int Soc Magn Reson Med 2009; 17: 92

Publication types