

Diffusion MR imaging of hypoglycemic encephalopathy
- PMID: 19875472
- PMCID: PMC7963995
- DOI: 10.3174/ajnr.A1856
Diffusion MR imaging of hypoglycemic encephalopathy
Abstract
Background and purpose: MR imaging features of HE have not been fully established. The purpose of this study was to determine the topographic distribution and DWI findings of HE.
Materials and methods: We retrospectively evaluated HE MR imaging (n = 11). The topographic distribution of the lesions was evaluated on routine MR imaging, and DWI SI and ADC values were assessed. The ADC value of involved lesions was compared with the noninvolved subcortical WM area by use of the paired t test.
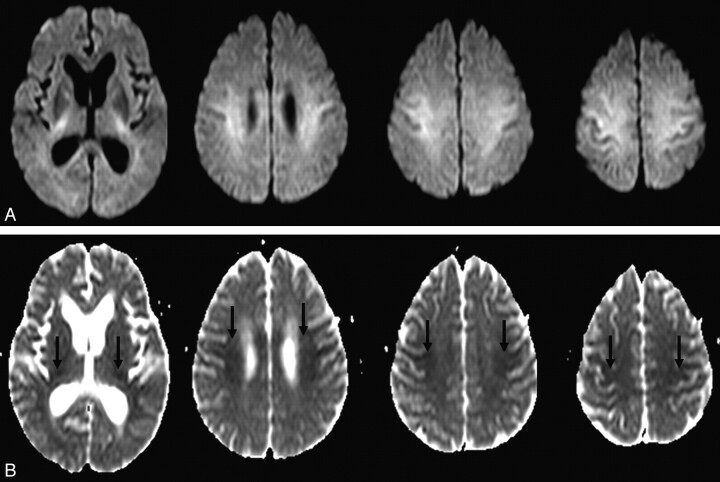
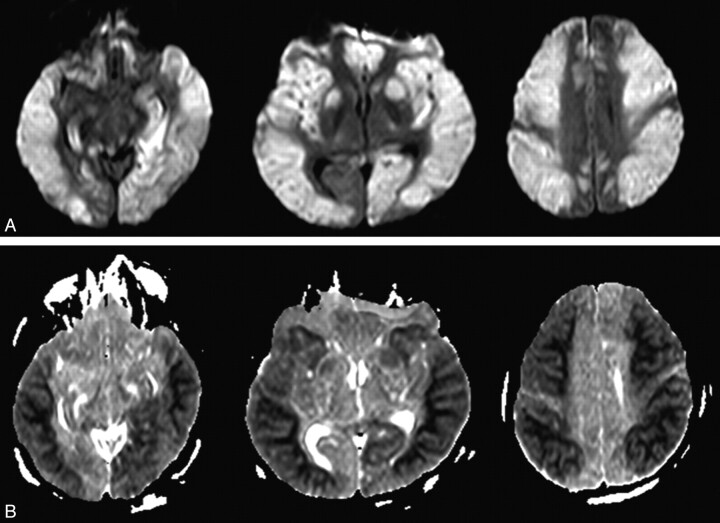
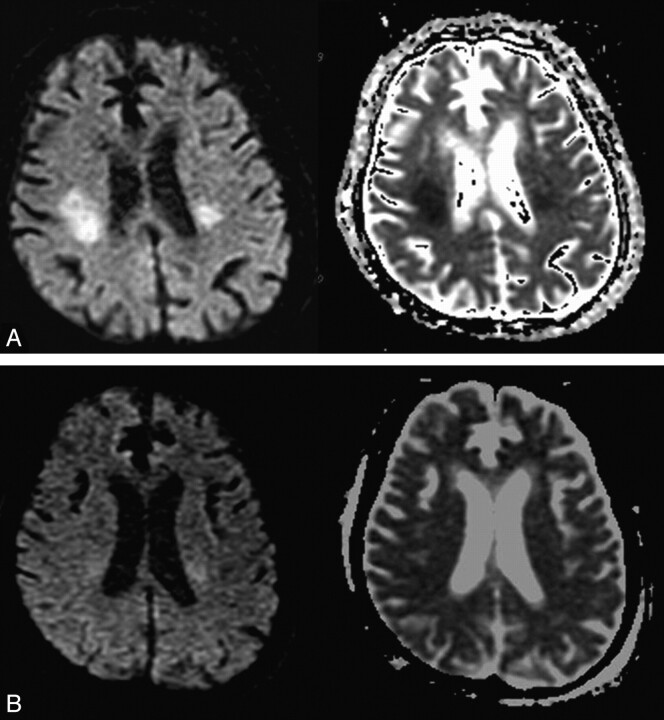
Results: MR images demonstrated bilateral diffusion-restrictive lesions in the posterior limb of the IC (n = 6), cerebral cortex (n = 8), CR (n = 7), CS (n = 9), hippocampus (n = 4), and BG (n = 1). The mean ADC value of lesions was 448.82 +/- 92.34 x 10(-6) mm(2)/s compared with the mean ADC value of noninvolved lesions (837.72 +/- 62.14 x 10(-6) mm(2)/s); this difference was statistically significant (P < .000). The lesions showed complete resolution on follow-up DWI for 6 patients. Three patients with cortical involvement of > or = 2 lobes showed partial recovery or death, but most of the other patients with WM involvement or cortical involvement in only 1 lobe experienced complete recovery.
Conclusions: The topographic localization of the lesions was the posterior limb of the IC, cerebral cortex, CR, CS, hippocampus, and BG. Most HE lesions probably correspond to areas of reversible cytotoxic edema as seen on DWI, which can predict the prognosis of HE according to the degree of lesion extent.
Figures
References
-
- Bottcher J, Kunze A, Kurrat C, et al. . Localized reversible reduction of apparent diffusion coefficient in transient hypoglycemia-induced hemiparesis. Stroke 2005;36:e20–22 - PubMed
-
- Finelli PF. Diffusion-weighted MR in hypoglycemia coma. Neurology 2001;57:933–35 - PubMed
-
- Shirayama H, Ohshiro Y, Kinjo Y, et al. . Acute brain injury in hypoglycemia-induced hemiplegia. Diabet Med 2004;21:623–24 - PubMed
-
- Auer RN, Wieloch T, Olsson Y, et al. . The distribution of hypoglycemic brain damage. Acta Neuropathol 1984;64:177–91 - PubMed
-
- Aoki T, Sato T, Hasegawa K, et al. . Reversible hyperintensity lesion on diffusion-weighted MRI in hypoglycemic coma. Neurology 2004;27:392–93 - PubMed
MeSH terms
Substances
LinkOut - more resources
Full Text Sources
Medical