. 2009 Dec;175(6):2657-67.
doi: 10.2353/ajpath.2009.090202. Epub 2009 Oct 29.

Cytogenetic abnormalities of tumor-associated endothelial cells in human malignant tumors

Affiliations

Cytogenetic abnormalities of tumor-associated endothelial cells in human malignant tumors

Tomoshige Akino et al. Am J Pathol. 2009 Dec.

Abstract

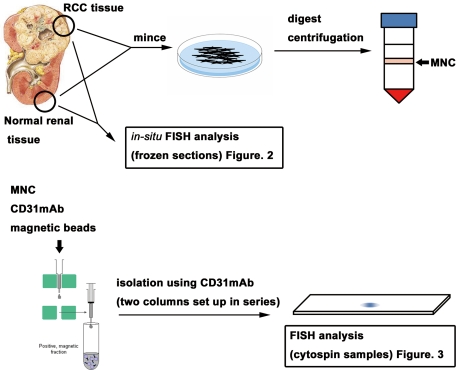
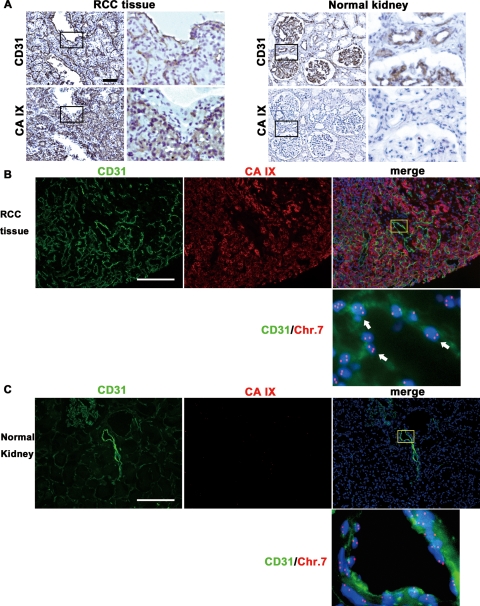
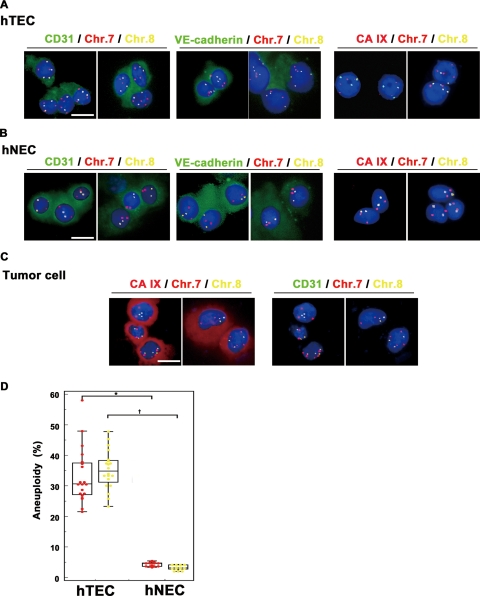
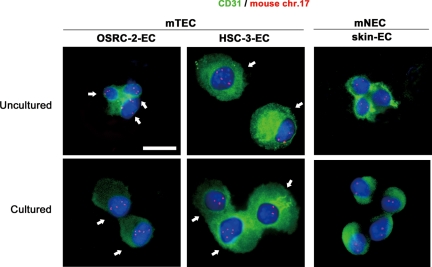
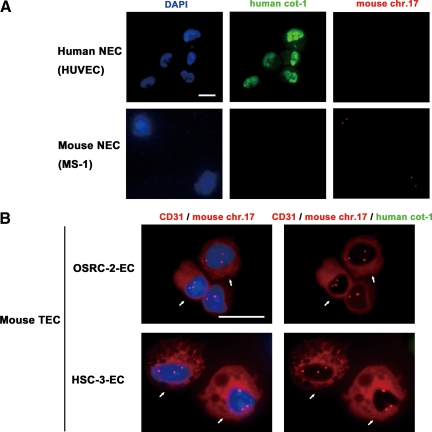
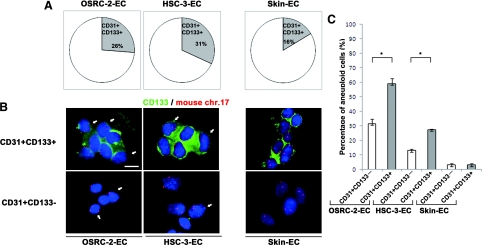
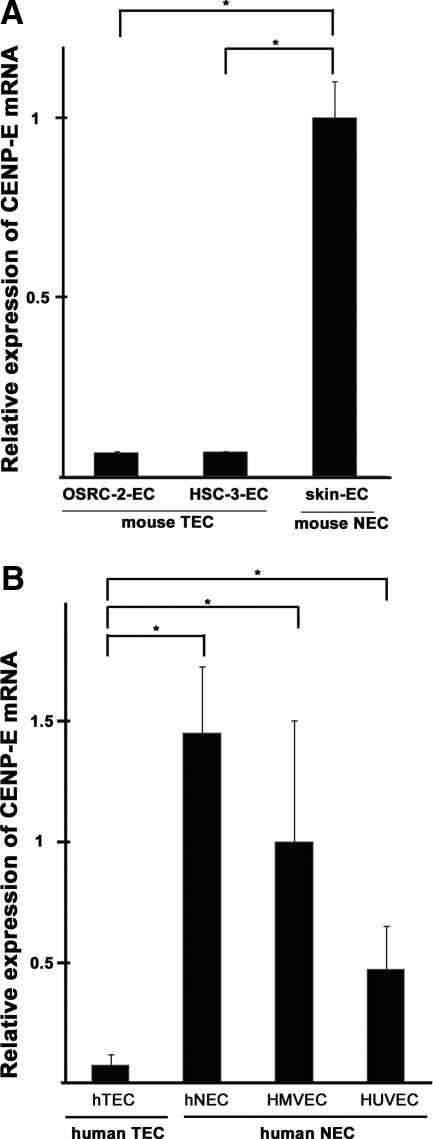
Tumor blood vessels are thought to contain genetically normal and stable endothelial cells (ECs), unlike tumor cells, which typically display genetic instability. Yet, chromosomal aberration in human tumor-associated ECs (hTECs) in carcinoma has not yet been investigated. Here we isolated TECs from 20 human renal cell carcinomas and analyzed their cytogenetic abnormalities. The degree of aneuploidy was analyzed by fluorescence in situ hybridization using chromosome 7 and chromosome 8 DNA probes in isolated hTECs. In human renal cell carcinomas, 22-58% (median, 33%) of uncultured hTECs were aneuploid, whereas normal ECs were diploid. The mechanisms governing TEC aneuploidy were then studied using mouse TECs (mTECs) isolated from xenografts of human epithelial tumors. To investigate the contribution of progenitor cells to aneuploidy in mTECs, CD133(+) and CD133(-) mTECs were compared for aneuploidy. CD133(+) mTECs showed aneuploidy more frequently than CD133(-) mTECs. This is the first report showing cytogenetic abnormality of hTECs in carcinoma, contrary to traditional belief. Cytogenetic alterations in tumor vessels of carcinoma therefore can occur and may play a significant role in modifying tumor- stromal interactions.


Figures

Figure 1
Figure 1
Schematic representation of hTEC and hNEC isolation. One portion of RCC or normal kidney tissue was immediately snap-frozen for immunohistology and FISH analysis. Another portion of RCC or normal kidney tissue was immediately processed to isolate ECs by MACS. hTECs were freshly isolated from RCC tissue. hNECs were also isolated from normal kidney tissue, apart from the tumor in the same specimens. FISH analysis was performed to investigate aneuploidy in tumor cell-free conditions. MNC, mononuclear cell.
Figure 2
Figure 2
FISH analysis in human RCC and normal renal tissue sections. A: CA IX immunostaining in RCC tissue and normal kidney tissue. Upper panels show CD31 staining in vascular ECs. Lower panels show that CA IX was expressed in tumor cells in RCC tissue but not in normal kidney tissue. Scale bar, 100 μm. B and C: FISH analysis in RCC tissue and normal kidney tissue immunostained for CD31 and CA IX. RCC tissue (B) and normal kidney (C) were stained for CD31 and CA IX. After immunohistochemistry, FISH was performed using a chromosome 7 DNA probe (red). Nuclei were counterstained with DAPI (blue). B shows that CD31 was expressed on ECs and CA IX was expressed on tumor cells separately in RCC tissue. ECs (green) with 3 or more chromosome 7 signals (red) were detected in RCC vessels (white arrows). C shows lack of CA IX expression in normal renal tissue sections. No aneuploid ECs were evident in normal renal vessels. Scale bars, 100 μm.
Figure 3
Figure 3
FISH analysis in freshly isolated and cytospun hTECs and hNECs. A and B: FISH analysis of freshly isolated and cytospun hTECs and hNECs. hTECs (A) and hNECs (B) were stained for CD31, VE-cadherin, or the RCC marker CA IX. FISH was performed using chromosome 7 (red) and chromosome 8 (yellow) DNA probes. Nuclei were counterstained with DAPI (blue). hNECs and hTECs were positive for VE-cadherin as well as CD31. No CA IX expression was observed in hNECs and hTECs. In FISH analysis, three or more chromosome 7 (red) and chromosome 8 (yellow) signals were detected in hTECs, indicating aneuploidy (A). On the other hand, hNECs showed two signals, indicating diploidy (B). C: Tumor cells (CA IX+CD31 cells with aneuploidy) were detected in the negative fraction of primary EC isolates. D: Aneuploidy was observed in isolated hTECs in all RCC samples by FISH analysis using chromosome 7 and chromosome 8 DNA probes. hTECs harbored more aneuploid cells compared with hNECs (P < 0.001, P < 0.001). Scale bars, 10 μm. To determine the percentage of aneuploid cells, 100 nuclei were evaluated in each sample. Aneuploid cells were counted three times in each sample. Statistical analysis was performed using the Mann-Whitney U-test. A value of P < 0.05 was considered significant.
Figure 4
Figure 4
FISH analysis in uncultured and cultured mTECs and mNECs. mTECs isolated from xenografts of human epithelial tumors were aneuploid. Cultured and uncultured mTECs were positive for CD31 (green). Nuclei were counterstained with DAPI (blue). Three or more chromosome 17 signals (red) were detected among uncultured mTECs (white arrows). Scale bar, 10 μm.
Figure 5
Figure 5
Immunocytochemistry and dual-probe FISH analysis in uncultured mTECs. A: Probes for dual-probe FISH were tested for specificity before use with mTECs. An FITC-human Cot-1 DNA probe hybridized in human ECs and HUVECs but not in mouse ECs (MS-1). On the other hand, a Cy-3-mouse chromosome 17 locus-specific probe hybridized in MS-1 cells but not HUVECs. Scale bar, 10 μm. B: Uncultured mTECs were immunostained with anti-CD31, followed by dual-probe FISH using a Cy3 mouse chromosome 17 locus-specific probe and a FITC-human Cot-1 DNA probe. Nuclei were counterstained with DAPI (blue). CD31+ cells (red) with three or more chromosome 17 signals (red), identifying them as aneuploid mTECs, were detected (white arrows). Aneuploid mTECs did not hybridize with human Cot-1 (green), suggesting there was no fusion between human tumor cells and mTECs. Scale bar, 10 μm.
Figure 6
Figure 6
Percentage of CD133+ cells among mTECs/mNECs and its correlation with aneuploidy. A: The percentage of CD133+ cells in mTECs was 26% (OSRC-2-ECs) and 31% (HSC-3-ECs), whereas that in mNECs was 16%. B: Uncultured mTECs or mNECs were immunostained with CD133 followed by FISH. Nuclei were counterstained with DAPI (blue). Three or more chromosome 17 signals (red) were detected in CD133+ (green) and CD133 mTECs (white arrows), whereas CD133+ and CD133 mNECs cells were diploid. C: Among mTECs, aneuploid cells were observed more frequently in CD31+CD133+ cells than in CD31+CD133 cells (P < 0.05). Scale bar, 10 μm.
Figure 7
Figure 7
Down-regulation of CENP-E expression in aneuploid TECs. A: CENP-E mRNA expression levels were compared between mTECs and mNECs by quantitative RT-PCR. CENP-E expression was significantly lower in mouse TECs (both OSRC-2-ECs and HSC-3-ECs) compared with mNECs (skin ECs) (P < 0.05, P < 0.05). B: CENP-E mRNA levels in isolated hTECs, hNECs, human microvascular ECs (HMVECs), and HUVECs. Compared with all human NECs (hNECs, HMVECs, and HUVECs), hTECs expressed significantly lower levels of CENP-E (P < 0.05).

References

    1. Folkman J. Angiogenesis in cancer, vascular, rheumatoid and other disease. Nat Med. 1995;1:27–31. - PubMed
    1. Hurwitz H, Fehrenbacher L, Novotny W, Cartwright T, Hainsworth J, Heim W, Berlin J, Baron A, Griffing S, Holmgren E, Ferrara N, Fyfe G, Rogers B, Ross R, Kabbinavar F. Bevacizumab plus irinotecan, fluorouracil, and leucovorin for metastatic colorectal cancer. N Engl J Med. 2004;350:2335–2342. - PubMed
    1. Miller KD, Chap LI, Holmes FA, Cobleigh MA, Marcom PK, Fehrenbacher L, Dickler M, Overmoyer BA, Reimann JD, Sing AP, Langmuir V, Rugo HS. Randomized phase III trial of capecitabine compared with bevacizumab plus capecitabine in patients with previously treated metastatic breast cancer. J Clin Oncol. 2005;23:792–799. - PubMed
    1. Escudier B, Pluzanska A, Koralewski P, Ravaud A, Bracarda S, Szczylik C, Chevreau C, Filipek M, Melichar B, Bajetta E, Gorbunova V, Bay JO, Bodrogi I, Jagiello-Gruszfeld A, Moore N. Bevacizumab plus interferon α-2a for treatment of metastatic renal cell carcinoma: a randomised, double-blind phase III trial. Lancet. 2007;370:2103–2111. - PubMed
    1. Folkman J. Angiogenesis: an organizing principle for drug discovery? Nat Rev Drug Discov. 2007;6:273–286. - PubMed

Publication types

MeSH terms