

Association of A1C and fasting plasma glucose levels with diabetic retinopathy prevalence in the U.S. population: Implications for diabetes diagnostic thresholds
- PMID: 19875604
- PMCID: PMC2768189
- DOI: 10.2337/dc09-0440
Association of A1C and fasting plasma glucose levels with diabetic retinopathy prevalence in the U.S. population: Implications for diabetes diagnostic thresholds
Abstract
Objective: To examine the association of A1C levels and fasting plasma glucose (FPG) with diabetic retinopathy in the U.S. population and to compare the ability of the two glycemic measures to discriminate between people with and without retinopathy.
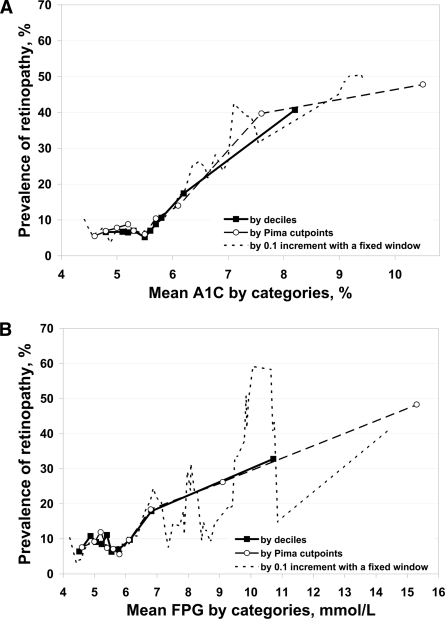
Research design and methods: This study included 1,066 individuals aged >or=40 years from the 2005-2006 National Health and Nutrition Examination Survey. A1C, FPG, and 45 degrees color digital retinal images were assessed. Retinopathy was defined as a level >or=14 on the Early Treatment Diabetic Retinopathy Study severity scale. We used joinpoint regression to identify linear inflections of prevalence of retinopathy in the association between A1C and FPG.
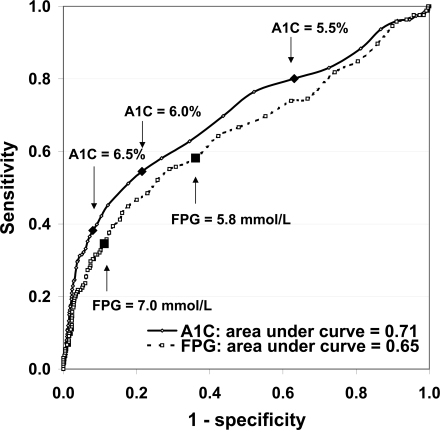
Results: The overall prevalence of retinopathy was 11%, which is appreciably lower than the prevalence in people with diagnosed diabetes (36%). There was a sharp increase in retinopathy prevalence in those with A1C >or=5.5% or FPG >or=5.8 mmol/l. After excluding 144 people using hypoglycemic medication, the change points for the greatest increase in retinopathy prevalence were A1C 5.5% and FPG 7.0 mmol/l. The coefficients of variation were 15.6 for A1C and 28.8 for FPG. Based on the areas under the receiver operating characteristic curves, A1C was a stronger discriminator of retinopathy (0.71 [95% CI 0.66-0.76]) than FPG (0.65 [0.60 - 0.70], P for difference = 0.009).
Conclusions: The steepest increase in retinopathy prevalence occurs among individuals with A1C >or=5.5% and FPG >or=5.8 mmol/l. A1C discriminates prevalence of retinopathy better than FPG.
Figures
Comment in
-
Can we become victims of our own success?Diabetes Care. 2009 Nov;32(11):2140-1. doi: 10.2337/dc09-1653. Diabetes Care. 2009. PMID: 19875611 Free PMC article. No abstract available.
References
-
- McCance DR, Hanson RL, Pettitt DJ, Bennett PH, Hadden DR, Knowler WC: Diagnosing diabetes mellitus: do we need new criteria? Diabetologia 1997;40:247–255 - PubMed
-
- Engelgau MM, Thompson TJ, Herman WH, Boyle JP, Aubert RE, Kenny SJ, Badran A, Sous ES, Ali MA: Comparison of fasting and 2-hour glucose and HbA1c levels for diagnosing diabetes. Diagnostic criteria and performance revisited. Diabetes Care 1997;20:785–791 - PubMed
-
- Expert Committee on the Diagnosis and Classification of Diabetes Mellitus: Report of the Expert Committee on the Diagnosis and Classification of Diabetes Mellitus. Diabetes Care 2003;26(Suppl. 1):S5–S20 - PubMed
