

Review
doi: 10.1038/nrd2973.
Can literature analysis identify innovation drivers in drug discovery?
Affiliations
- PMID: 19876041
- PMCID: PMC7097144
- DOI: 10.1038/nrd2973
Item in Clipboard
Review
Can literature analysis identify innovation drivers in drug discovery?
Nat Rev Drug Discov.
2009 Nov.
Abstract
Drug discovery must be guided not only by medical need and commercial potential, but also by the areas in which new science is creating therapeutic opportunities, such as target identification and the understanding of disease mechanisms. To systematically identify such areas of high scientific activity, we use bibliometrics and related data-mining methods to analyse over half a terabyte of data, including PubMed abstracts, literature citation data and patent filings. These analyses reveal trends in scientific activity related to disease studied at varying levels, down to individual genes and pathways, and provide methods to monitor areas in which scientific advances are likely to create new therapeutic opportunities.
Figures
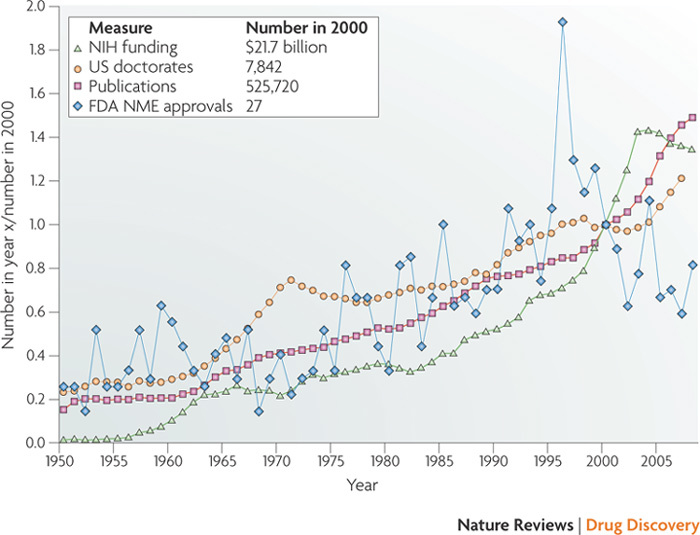
Data are presented as multiples of the values in the year 2000, which are given in the inset key. National Institutes of Health (NIH) funding data (green triangles) were taken from Ref. and adjusted for inflation. Doctorates awarded in the US in either biology or chemistry (orange circles) were taken from Refs , .Publications data (red squares) were determined by counts of articles returned by PubMed when restricted to individual years by the standard filter function for publication date. US Food and Drug Administration (FDA) approvals of new molecular entities (NMEs) (blue diamonds) were determined using the Drug Approval Reports form on the US FDA Center for Drug Evaluation and Research website (see Further information). The number of NME approvals was determined from the tables based on the 'New Drug Application Chemical Type' column entries. When multiple approvals of the same compound in different formulations occured in the same month, these were counted only once. We excluded technetium-based imaging reagents, for which 15 NME approvals were granted for diagnostic kits.
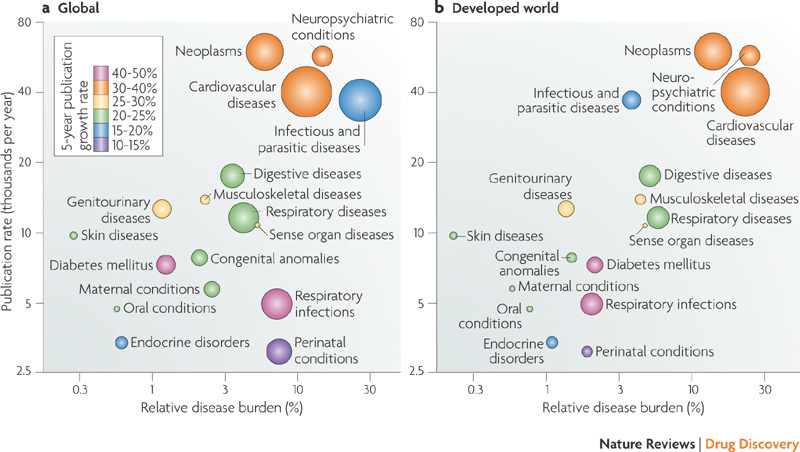
Horizontal axes represent the relative burdens of various disease categories to society, as determined by the World Health Organization (WHO) in 2002. The disability-adjusted life year (DALY) metric for each disease area, which combines a population's years of life lost to each cause with the years of life lived with disabilities (weighted by severity), was divided by the total DALY for all causes to give the relative disease burdens. The vertical axis indicates the average publication rate in thousands of scientific articles per year, over the years 1998–2007 inclusive. Both axes are on logarithmic scales. Each circle represents a therapeutic area as defined by the WHO disease categories, which were mapped to the US National Library of Medicine's medical subject headings (MeSH) that are used for PubMed queries (see Supplementary information S1 (table) ). Part a shows overall global figures, whereas part b is restricted to the developed world, again as defined by the WHO report. The areas of the circles reflect the annual number of deaths for each cause, as a proportion of the relevant population. Circle radii are therefore scaled to the cube root of mortality rates (corresponding to the cross-section of a sphere), and standardized in each part to cardiovascular deaths, which were maximal in both cases: 16,733,160 globally and 6,333,713 in the developed world. For comparison, deaths from diabetes were 987,816 and 244,599, respectively.
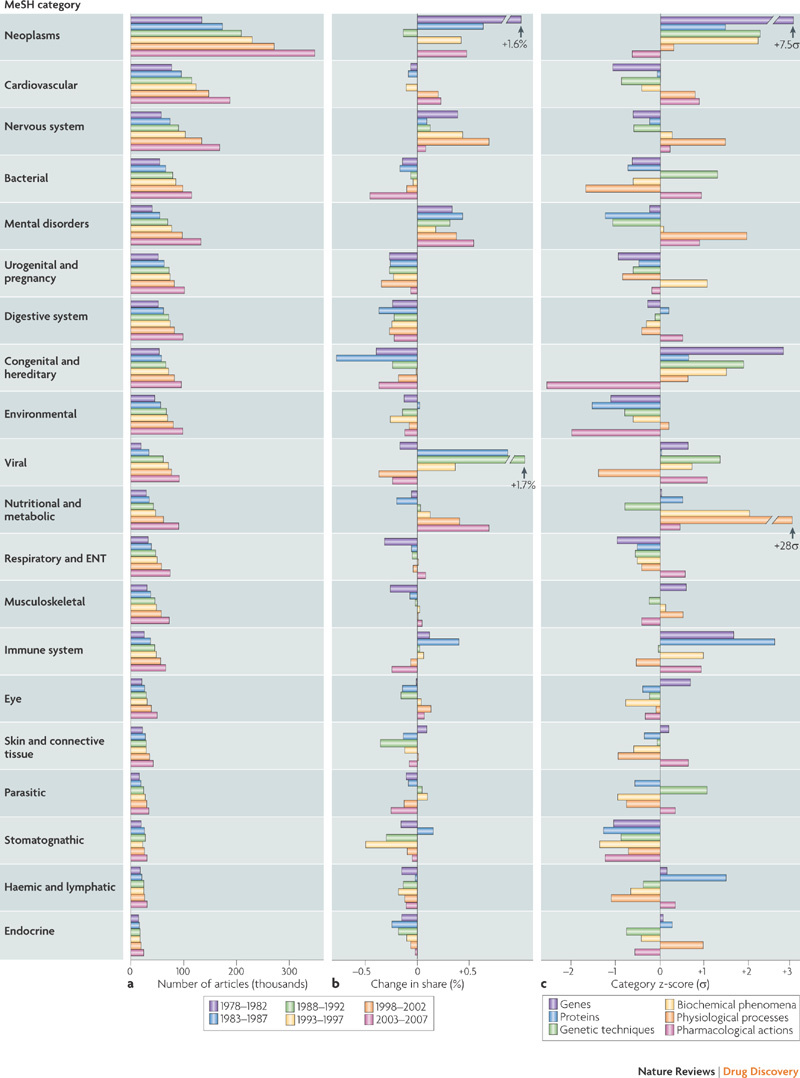
The disease areas for each column were derived from top-level medical subject headings (MeSH), as described in the main text. a | Numbers of articles published by 5-year spans, given in the inset key (left). b | Changes in 'market share' of each disease area relative to that of the previous period. Share was calculated by dividing the number of articles in the given disease area by the total number of articles published in all disease areas. Time spans are as in part a. Two values that are off-scale are indicated by arrows. c | Characterization of disease areas by various additional MeSH categories, indicated in the inset key (right) and described in the main text. The fraction of articles in each disease area with the given annotation is calculated, followed by the mean and standard deviation over all disease areas. The difference between each fraction and the mean is divided by the standard deviation to determine a z-score. In calculating the statistical parameters, two outliers (marked by arrows) were omitted so as not to compress the scale due to a large standard deviation. ENT, ear, nose and throat.
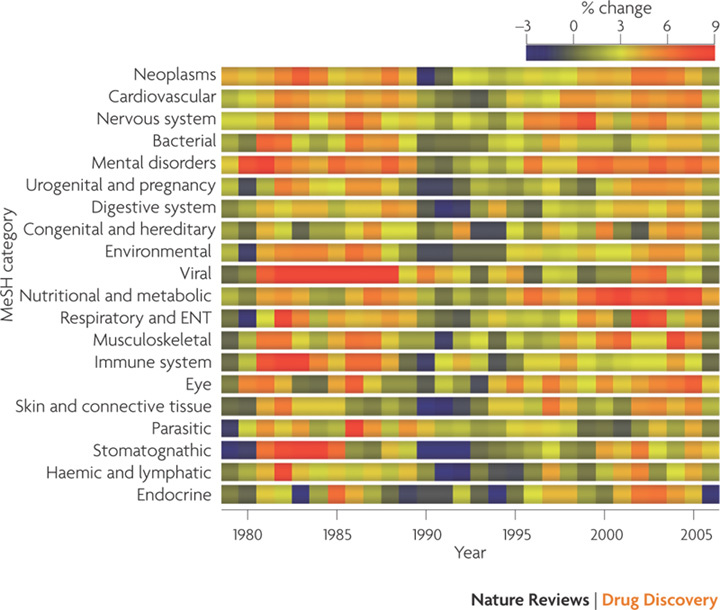
The rate of change in the numbers of publications in each disease area (measured as in Figure 2) for each year from 1979 to 2006. Red 'hot spots' indicate surges of publication and dark blue areas represent periods of reduced activity. ENT, ear, nose and throat; MeSH, medical subject heading.
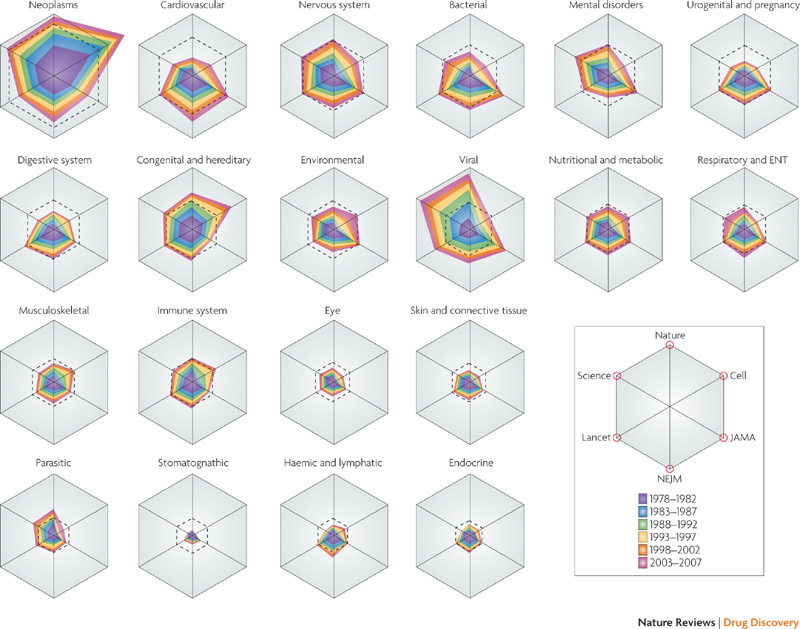
Each 'radar plot' indicates the relative extent of representation of the indicated medical subject heading (MeSH) in six journals: Nature, Science, Cell, The Journal of the American Medical Association (JAMA), The New England Journal of Medicine (NEJM) and The Lancet. Journals are oriented around the hexagons according to the key (bottom right), with basic-science journals at the top and medical journals at the bottom. Values on each axis represent the proportion of the given disease area relative to the overall number of disease-related articles in that journal. The outer edge of each hexagon frame represents 25% of disease-related articles, and the axes are scaled by the square roots of the fractions so that the areas of the polygons approximate the overall counts. The nested irregular polygons represent cumulative contributions of successive 5-year spans, as indicated in the key, so that widths of colour bands reflect the relative contributions for those periods. The superimposed dotted hexagons show the percentage represented by that disease area in the entire disease-related scientific literature for the overall period. ENT, ear, nose and throat.
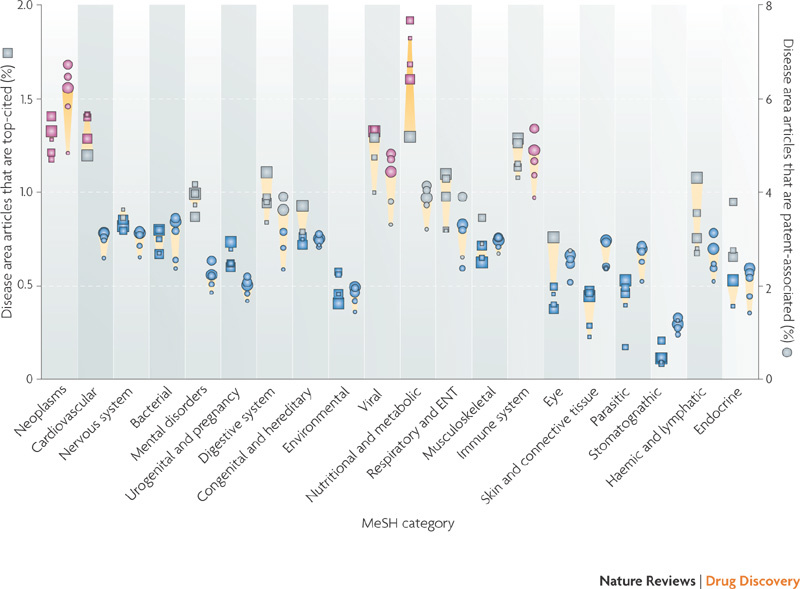
This figure shows percentages of highly-cited articles (squares) and patent filings (circles) in each disease area. In each column the icons, from smallest to largest, represent the years 2002–2006. Red icons indicate the values are greater than expected by chance, blue icons represent values that are less than expected by chance and grey icons represent values that are the same as expected by chance, according to a two-sided Fisher's Exact test (p < 0.05) with Bonferroni correction for multiple hypothesis testing. Yellow trapezoids connect the icons representing the first and last years of the span, giving some indications of spread and trend, but not of statistical significance. Squares on the left side of each column represent the numbers of highly-cited articles, determined by finding the 1% most-cited articles published in each year in all disease areas and then dividing the contribution of each disease area by this total. Therefore, the expected value for sets of articles chosen at random would be 1%. Circles on the right side of each column represent the percentages of articles in each disease area that are associated with patent filings, as described in Box 2. ENT, ear, nose and throat; MeSH, medical subject heading.
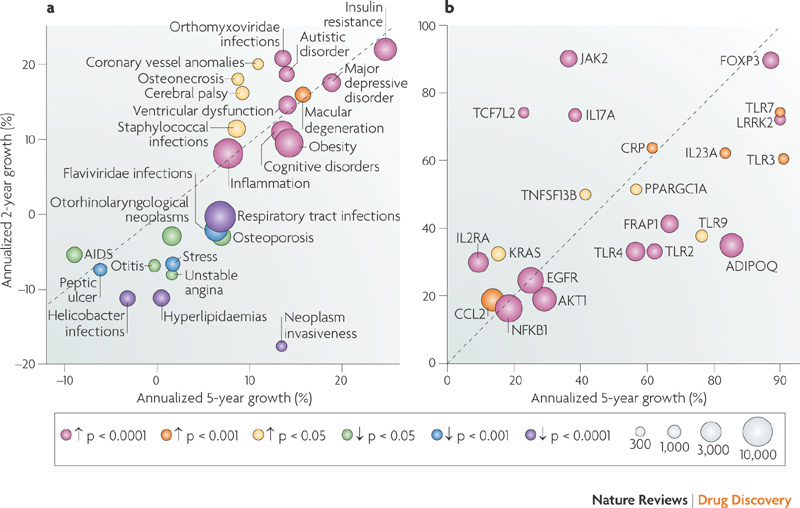
The horizontal axes show percentage growth in 2003–2007 relative to 1997–2002, and the vertical axes show growth in 2006–2007 relative to 2004–2005. The diagonal therefore indicates points for which growth is consistent in the short and medium term; publication rates of points above the diagonal are accelerating and those for points below the diagonal are decelerating. The size of the circles indicates the number of publications in the final 2 years surveyed, as shown in the key (grey circles, scaled to the cube root of publication count). Colours indicate the statistical significance of the 2-year differences after Bonferroni correction for multiple testing, for either positive or negative growth, as defined in the key (coloured circles; arrows pointing up indicate positive growth and arrows pointing down indicate negative growth). a | Changes in publication rates concerning medical subject heading (MeSH) disease subcategories that achieve statistical significance (out of 4,354). Several diseases are not shown, in cases in which their MeSH annotation changed between 1998–2007, or in which the categories were very broad, had fewer than 500 publications in 2006–2007, or were closely related to another disease already shown. Coronavirus infections (mostly due to severe acute respiratory syndrome) were off the scale, with 84% annualized growth on the 5-year axis but 36% annual decline over the past 2 years. b | Changes in publication rates concerning genes that achieve statistical significance (out of 13,024). Only genes with over 100 identifiable publications in 2006–2007 are shown. The overall analysis may be biased toward genes with more established and consistent nomenclature, as it was necessary to scan abstracts for gene symbols and known synonyms to derive this data. ADIPOQ, adiponectin, C1Q and collagen domain-containing; CCL2, CC-chemokine ligand 2; CRP, C-reactive protein; EGFR, epidermal growth factor receptor; FOXP3, forkhead box P3; FRAP1, FK506 binding protein 12-rapamycin associated protein 1 (also known as mTOR); IL17A, interleukin-17A; IL-23A, interleukin-23 subunit-a; IL2RA, interleukin-2 receptor-α; JAK2, janus kinase 2; LRRK2, leucine-rich repeat kinase 2; NFKB1, nuclear factor kB1; PPARGC1A, peroxisome proliferator-activated receptor-γ, coactivator 1α; TCF7L2, transcription factor 7-like 2; TLR, toll-like receptor; TNFSF13B, tumour necrosis factor (ligand) superfamily, member 13b.
Similar articles
-
What makes a good drug target?Drug Discov Today. 2011 Dec;16(23-24):1037-43. doi: 10.1016/j.drudis.2011.09.007. Epub 2011 Sep 16. Drug Discov Today. 2011. PMID: 21945861 Review.
-
The need for scientific software engineering in the pharmaceutical industry.J Comput Aided Mol Des. 2017 Mar;31(3):301-304. doi: 10.1007/s10822-016-9997-x. Epub 2016 Dec 19. J Comput Aided Mol Des. 2017. PMID: 27995514
-
The impact of chemoinformatics on drug discovery in the pharmaceutical industry.Expert Opin Drug Discov. 2020 Mar;15(3):293-306. doi: 10.1080/17460441.2020.1696307. Epub 2020 Jan 22. Expert Opin Drug Discov. 2020. PMID: 31965870
-
Mining emerging biomedical literature for understanding disease associations in drug discovery.Methods Mol Biol. 2014;1159:171-206. doi: 10.1007/978-1-4939-0709-0_11. Methods Mol Biol. 2014. PMID: 24788268 Review.
-
Society for Biomolecular Sciences--15th Annual Conference. Bioassay and technology innovation: 15 years of shaping drug discovery. 26-30 April 2009, Lille, France.IDrugs. 2009 Jun;12(6):363-5. IDrugs. 2009. PMID: 19517316 No abstract available.
Cited by
-
Patterns of technological innovation in biotech.Nat Biotechnol. 2012 Oct;30(10):937-43. doi: 10.1038/nbt.2389. Nat Biotechnol. 2012. PMID: 23051809 Review. No abstract available.
-
Adoption of the Citation Typing Ontology by the Journal of Cheminformatics.J Cheminform. 2020 Aug 6;12(1):47. doi: 10.1186/s13321-020-00448-1. J Cheminform. 2020. PMID: 33430994 Free PMC article. No abstract available.
-
Empowering industrial research with shared biomedical vocabularies.Drug Discov Today. 2011 Nov;16(21-22):940-7. doi: 10.1016/j.drudis.2011.09.013. Epub 2011 Sep 23. Drug Discov Today. 2011. PMID: 21963522 Free PMC article. Review.
-
Tracking 20 years of compound-to-target output from literature and patents.PLoS One. 2013 Oct 29;8(10):e77142. doi: 10.1371/journal.pone.0077142. eCollection 2013. PLoS One. 2013. PMID: 24204758 Free PMC article.
-
Quantitative biomedical annotation using medical subject heading over-representation profiles (MeSHOPs).BMC Bioinformatics. 2012 Sep 27;13:249. doi: 10.1186/1471-2105-13-249. BMC Bioinformatics. 2012. PMID: 23017167 Free PMC article.
References
Publication types
MeSH terms
LinkOut - more resources
Full Text Sources
