. 1991 Jan;51(1):128-34.
doi: 10.1097/00007890-199101000-00020.

The liver transplant waiting list--a single-center analysis

Affiliations

The liver transplant waiting list--a single-center analysis

R D Gordon et al. Transplantation. 1991 Jan.

Abstract

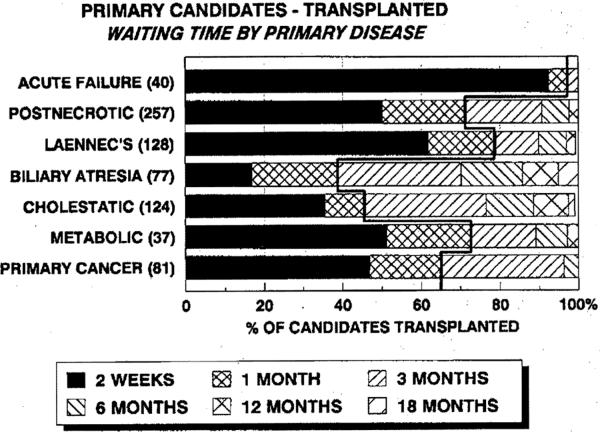
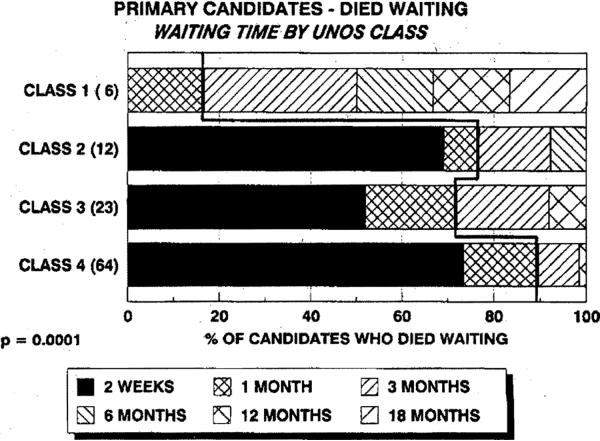
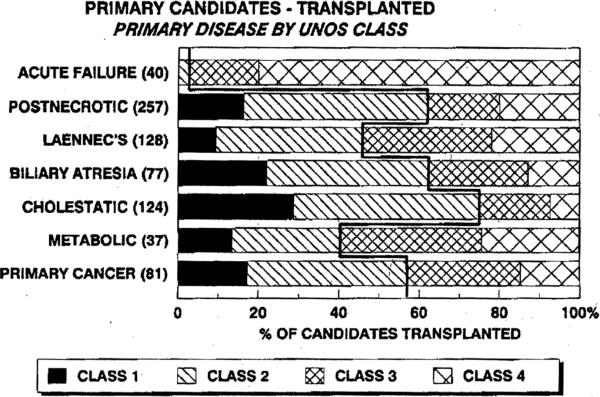
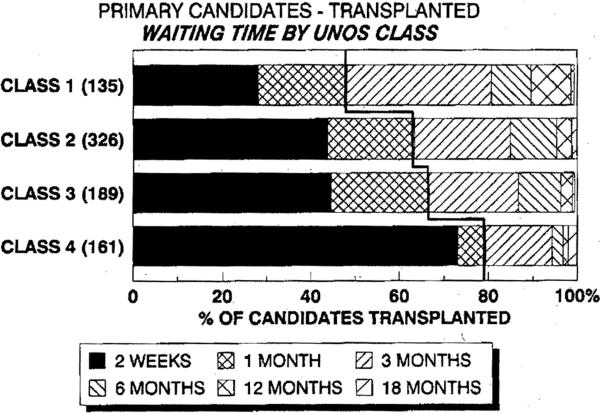
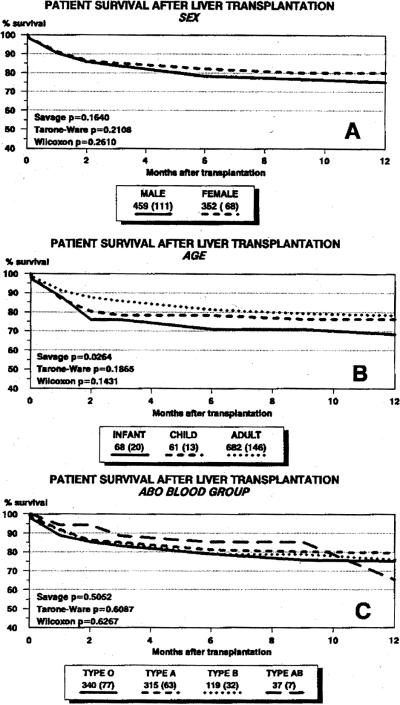
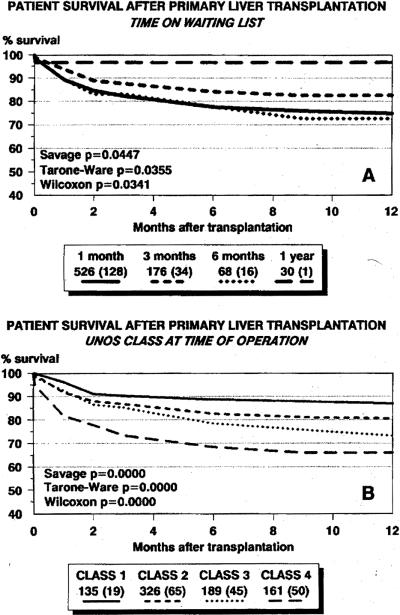
At this transplant center 1340 patients were entered on the liver transplant waiting list during the first 25 months (October 1987 to November 1989) after the initiation of the UNOS allocation system for liver grafts. Of these 972 (72.5%) of the patients received a graft, 120 (9.0%) died waiting for a graft, 109 (8.1%) remained on the active list as of the study endpoint of December 15, 1989, 123 (9.2%) were withdrawn from candidacy, and 16 (1.2%) received a transplant at another center. A total of 1201 patients were candidates for a first graft. Of the 812 primary candidates who received a graft, 64.8% received their graft within one month of entry on the waiting list. Of the 109 primary candidates who died before a graft could be found, 79.0% died within a month of entry onto the waiting list. At time of transplantation, 135 (16.6%) primary recipients of a graft were UNOS class 1, 326 (40.1%) were UNOS class 2, 190 (23.4%) were UNOS class 3, and 161 (19.8%) were UNOS class 4. Actuarial survival rates (percentage) at 6 months for recipients in UNOS class 1, class 2, class 3, and class 4 were 88.7 +/- 2.9, 82.6 +/- 2.1, 78.4 +/- 3.2, and 68.4 +/- 3.9, respectively (P less than 0.001). At the time of death of recipients who failed to get a graft, 6 (5.5%) were UNOS class 1, 14 (12.8%) were UNOS class 2, 23 (21.1%) were UNOS class 3, and 66 (60.6%) were UNOS class 4. These results indicate that a high proportion of liver transplant candidates are in urgent need of a graft and that the UNOS system succeeds in giving these patients high priority. However patient mortality on the waiting list and after transplantation would lessen significantly if more patients with end-stage liver disease were referred to the transplant center in a timely manner before their condition reaches the point where the probability of survival is diminished.


Figures

Figure 1
Figure 1
The proportion of candidates who received a primary graft within specified intervals according to the primary indication for liver replacement. The meandering bold line indicates the proportion of patients who received a graft within one month of entry on to the waiting list. The further the line shifts to the right, the higher the proportion of patients receiving a graft within one month.
Figure 2
Figure 2
The proportion of candidates who died after specified intervals before a graft could be found according to UNOS class (medical priority). There were 109 primary candidates who died waiting. The exact date of death for 4 cases was not known, leaving 105 cases available for analysis. The meandering bold line indicates the relative proportion of patients who died within one month of entry to the waiting list.
Figure 3
Figure 3
The proportion of candidates for a first liver graft in each UN OS class of medical urgency at the time of transplantation according to primary liver disease. The meandering bold line separates the proportion of patients in higher-risk groups (classes 3 and 4) from those in moderate- (class 2) and low-risk groups (class 1). The further the line shifts to the left, the higher the proportion of patients in classes 3 and 4.
Figure 4
Figure 4
The proportion of candidates who received a primary paft within specified intervals according to-UNOS class (medical priority). The meandering bold line separates the proportion of patients in higher-risk groups (classes 3 and 4) from those in moderate- (class 2) and low-risk (class 1) groups. The further the line shifts to the left, the higher the proportion of patients in classes 3 and 4.
Figure 5
Figure 5
Actuarial survival rates for 811 primary graft recipients based on sex (A), age group (B), and ABO blood group (C).
Figure 6
Figure 6
(A) Actuarial (life-table) survival rates for graft recipients based on accumulated waiting list time. One month includes all patients receiving a graft within 30 days of entry on to the waiting list. Three months includes all patients receiving a graft more than 30 days but within 90 days of entry. Six months includes all patients receiving a graft more than 90 days but within 180 days of entry. One year includes all patients given a graft more than 180 days but within 365 days of entry. (B) Actuarial (life-table) survival rates for graft recipients based on UNOS class (medical urgency) at the time of transplantation.

References

    1. Starzl TE, Gordon RD, Tzakis AG, et al. Equitable allocation of extrarenal organs: with special reference to the liver. Transplant Proc. 1988;20:131. - PMC - PubMed
    1. Gordon RD, Starzl TE. A microcomputer based approach to data management: an essential tool in the assessment of trends and results in liver transplantation. Semin Liver Dis. 1985;5:329. - PMC - PubMed
    1. Markus BH, Mitchell S, Gordon RD, Gilquist B, Starzl TE. TIMY—a center oriented transplant information management system. Transplant Proc. 1988;20:385. - PMC - PubMed
    1. Shaw BW, Jr, Wood RP, Stratta RJ, et al. Stratifying the causes of death in liver transplant recipients: an approach to improving survival. Arch Surg. 1989;124:895. - PubMed

Publication types

Substances