Review
. 2009 Nov;15(11):1395-411.
doi: 10.1002/lt.21866.

Human liver transplantation as a model to study hepatitis C virus pathogenesis

Affiliations
Review

Human liver transplantation as a model to study hepatitis C virus pathogenesis

Michael G Hughes Jr et al. Liver Transpl. 2009 Nov.

Abstract

Hepatitis C is a leading etiology of liver cancer and a leading reason for liver transplantation. Although new therapies have improved the rates of sustained response, a large proportion of patients (approximately 50%) fail to respond to antiviral treatment, thus remaining at risk for disease progression. Although chimpanzees have been used to study hepatitis C virus biology and treatments, their cost is quite high, and their use is strictly regulated; indeed, the National Institutes of Health no longer supports the breeding of chimpanzees for study. The development of hepatitis C virus therapies has been hindered by the relative paucity of small animal models for studying hepatitis C virus pathogenesis. This review presents the strengths of human liver transplantation and highlights the advances derived from this model, including insights into viral kinetics and quasispecies, viral receptor binding and entry, and innate and adaptive immunity. Moreover, consideration is given to current and emerging antiviral therapeutic approaches based on translational research results.


Figures

Figure 1
Figure 1
The liver is enriched for antigen-specific cytotoxic T lymphocytes (CTLs). A) Flow cytometric dot plot gated on CD3+CD8+ T cells showing HCV-specific CTLs A2–1073 (R4) enriched within the hepatic compartment. Expression of PD-1 on Ag-specific (71.74%) cells relative to bulk CTLs (6.02%) is shown in the histogram. CTLs shown in R5 may include cells reactive against other regions of HCV. B) Total HCV-specific PD-1 expressed as a percentage of pentamer+ CD8+ T cells as the (mean fluorescence intensity) MFI. Chronic HCV infection is associated with a greater percentage of PD-1+ HCV-specific CTLs in the periphery (n = 17 patients, 45 pentamers responses), as well as in the liver (n = 9 patients, 29 pentamers). The data are shown for seven patients (21 pentamers) with resolved infection. The intensity of PD-1 staining is also higher on the cells of chronically infected patients, showing the most concentrated PD-1 expression in the liver.
Figure 2
Figure 2
Schematic of Perioperative Viral Kinetics (Adapted from Garcia-Retortillo et al33). Serum viral load remains fairly stable during hepatectomy as the liver continues to release virus into the circulation. During the anhepatic phase, viral load begins to decrease, as the virus producing liver has been removed. Rate of viral decrease during this stage is related to blood loss and dilution from resuscitation. With reperfusion of the allograft, virus is rapidly removed from the circulation by the previously uninfected allograft. It appears that allografts are variable in their ability to bind and remove virus, as rates of viral clearance differ markedly. Viral load reaches a nadir (likely due to saturation of cell-surface receptors for the virus) and then starts to increase with established infection and viral replication.
Figure 3
Figure 3
Quasispecies selective nature of allograft infection. As demonstrated in a single, representative patient, only a portion of HVR1 quasispecies binds and subsequently infects the liver. New quasispecies are rapidly generated with allograft infection and intrahepatic viral replication (taken with permission from Hughes et al.39). First sequence represents the consensus sequence. Each letter of sequence represents the amino acid at the given position. Hyphens represent conserved amino acids. Number next to each sequence represents the number of times that sequence was identified in the given sample.
Figure 4
Figure 4
HVR1 quasispecies selected out by the liver are more closely related than the pool of quasispecies in the pretransplant serum inoculum. With generation of new quasispecies, diversity increases (taken with permission from Hughes et al.39). MAAD=maximal amino acid diversity. Grey lines represent individual patients. Black line represents mean values.
Figure 5
Figure 5
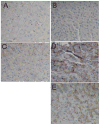
CD81 expression (brown staining) following liver transplantation: (a) explant liver; allograft (b) 2 hours after reperfusion, (c) 3 days, (d) 1 week, and (e) 2 months posttransplant (taken with permission from Hughes et al.39).
Figure 6
Figure 6
Levels of CD56+ lymphocytes in chronic HCV patients and HCV-negative liver disease patients prior to liver transplantation as well as normal healthy controls. Multi-parameter flow cytometric analysis was used to estimate the levels of CD56 lymphocytes, NK (CD56+CD3) and NT(CD56+CD3+) cells in chronic HCV infection prior to liver transplantation (A). Total CD56+ lymphocyte levels are significantly decreased in all chronic HCV patients compared to normal uninfected control subjects. This reflects a deficiency in both NK and NT cells. A decrease in total CD56+ cells was also observed for control non-HCV chronic liver disease patients due to a significant reduction in NT but not NK cells. Chronic HCV patients were stratified into two groups depending on severity of disease recurrence post liver transplantation. Of interest, all CD56+ lymphocyte populations were decreased in the patient group with subsequent severe outcome compared to those who had mild recurrence of HCV liver disease. Compared to non-HCV liver disease, this reduction was significant for total CD56+ and NK (but not NT) cells only for the severe group (B). *p < 0.05. (From Rosen et al.132).
Figure 7
Figure 7
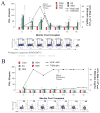
Longitudinal analyses of HCV-specific in two patients with severe cholestatic HCV who received antiviral therapy. Both patients were HLA A2+ recipients of HLA A2+ donor livers. A) Reconstitution of HCV-specific cellular immunity in a patient with severe cholestatic HCV recurrence who responded to antiviral therapy (HCV RNA expressed as 106 copies/mL). (Top) IFN- ELISPOT (enzyme-linked immunospot) responses to HCV recombinant proteins, viral load and serum bilirubin. (Middle) CD8+ T-cell responses to NS3 1073 tetramer. (Bottom) Amino acid sequence of NS3 1073–1081 epitope at 4 time points (HCV genotype 1a prototype sequence: CINGVCWTV). B) HCV-specific immune responses in a patient with severe cholestatic HCV recurrence who failed to respond to antiviral therapy (HCV RNA expressed as 106 copies/mL). (Top) IFN-γ ELISPOT responses to HCV recombinant proteins, viral load, and serum bilirubin. (Middle) CD8+ T-cell responses to NS3 1073 tetramer. (Bottom) Amino acid sequence of NS3 1073–1081 epitope at 4 time points (HCV genotype 1a prototype sequence: CINGVCWTV); amino acid substitution (V for I at position 2 was detected but remained stable over time). (Taken from Weston et al.137). {Editor: provided are original color figures, can use the figures as they appear in Hepatology manuscript}.
Figure 8
Figure 8
Recipient-derived T cells that recognize HCV peptides in the context of donor HLA molecules (HLA A2). Taken together, these results suggest that T cells circulate in liver transplant recipients and are not activated until they encounter donor alleles containing HCV peptides. Top) ELISPOT assay was performed with 1,000 T cells, 20,000 LCLs expressing A2 allele (top row), A3 allele (middle row), or syngeneic (recipient-derived) LCLs (bottom row) cocultured with no peptide, cognate peptide (NS31406–1415, KLVALGINAV) or irrelevant HCV core peptide (core35–44, YLLPRRGPRL). (Taken from Rosen et al.143). Bottom) Demonstration that these HCV-specific clones do not react to allo-HLA alone. Lymphoid cell lines (LCLs) expressing all potential HLA class I alleles from donor and recipient were used as antigen presenting cells. Briefly, no peptide or cognate peptide (KLVALGINAV) was added to 3 X 10⁶ LCLs and 1.5 X 10⁶ clones were co-cultured for a total of 6 hrs (Monensin 2μM added after 2 hrs). Cells were rinsed twice with PBS + 1% BSA and stained for 30–40 minutes with tetramer; cells were rinsed twice, fixed in 200μL of 4% paraforaldehyde for at least 15 minutes then permeabilized with 2 mL 1X PermWash (Pharmingen) for half an hour at 4°C. Permeabilized cells were stained with monoclonal antibodies to IFNγ Stained cells were washed twice in 2mL PBS + 1% BSA and fixed in 300μL 2% paraformaldehyde. Acquisition was performed within 24 hours of staining; all flow cytometry data were collected using a FACS-Calibur flow cytometer (BD Biosciences) and analyzed with CellQuest software (BD Biosciences). A) no peptide, LCL HLA A2A3B14B44; B) cognate peptide and LCL HLA A2A3B14B44; C) cognate peptide and LCL HLA A3A24B62B18; D) cognate peptide and LCL HLA A30A33B13B14; E) cognate peptide and LCL HLA A1A3B7B50; F) cognate peptide and LCL HLA A3A30B7B13 (recipient derived).

Similar articles

Cited by

References

    1. Gane EJ. The natural history of recurrent hepatitis C and what influences this. Liver Transpl. 2008;14 (Suppl 2):S36–44. - PubMed
    1. Gordon FD, Kwo P, Vargas HE. Treatment of hepatitis C in liver transplant recipients. Liver Transpl. 2009;15(2):126–35. - PubMed
    1. Terrault NA. Hepatitis C therapy before and after liver transplantation. Liver Transpl. 2008;14 (Suppl 2):S58–66. - PubMed
    1. Cohen J. Animal studies. NIH to end chimp breeding for research. Science. 2007;316(5829):1265. - PubMed
    1. Mercer DF, Schiller DE, Elliott JF, et al. Hepatitis C virus replication in mice with chimeric human livers. Nat Med. 2001;7(8):927–33. - PubMed

Publication types

Substances