Review
. 2009;24 Suppl 2(0 2):S725-31.
doi: 10.1002/mds.22541.

Metabolic networks for assessment of therapy and diagnosis in Parkinson's disease

Affiliations
Review

Metabolic networks for assessment of therapy and diagnosis in Parkinson's disease

Shigeki Hirano et al. Mov Disord. 2009.

Abstract

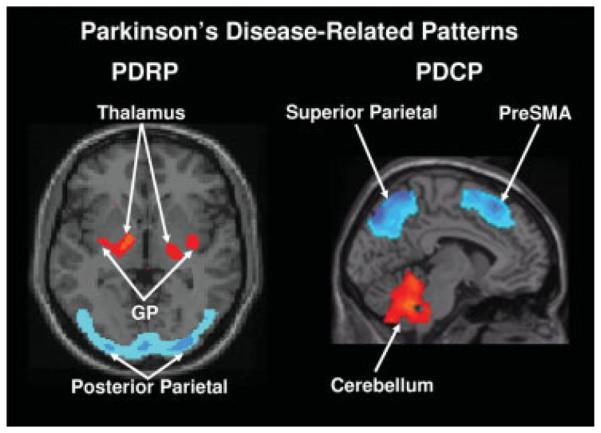
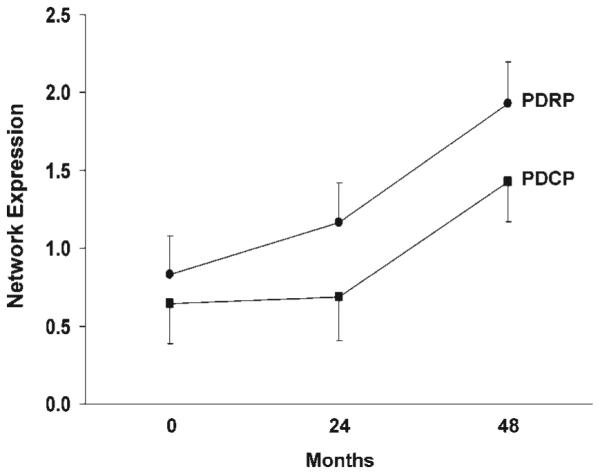
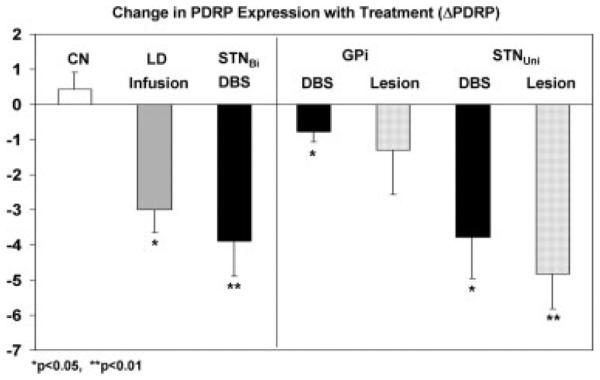
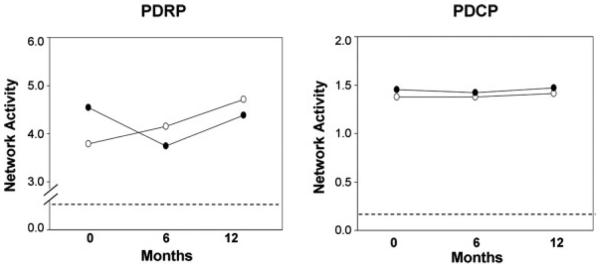
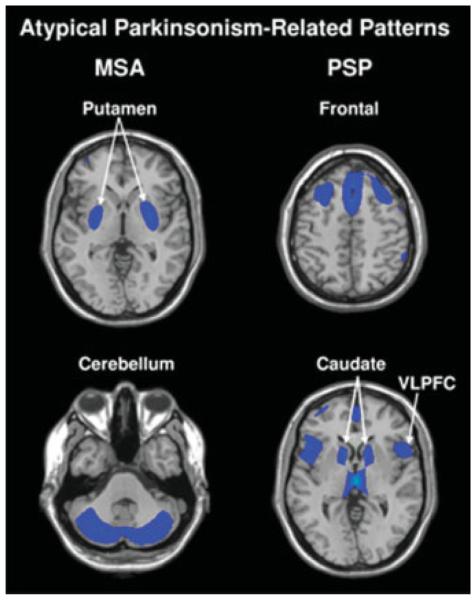
Neuroimaging and modern computational techniques like spatial covariance analysis have contributed greatly to the understanding of neural system abnormalities in neurodegenerative disorders such as Parkinson's disease (PD). The application of network analysis to metabolic PET data obtained from patients with PD has led to the identification and validation of two distinct spatial covariance patterns associated with the motor and cognitive manifestations of the disease. Quantifying the activity of these patterns in individual subjects has provided an objective tool for the assessment of treatment efficacy and differential diagnosis. We have found that activity of the PD motor-related network is modulated by antiparkinsonian treatments such as dopaminergic therapy, deep brain stimulation (DBS), and subthalamic nucleus (STN) gene therapy. By contrast, the cognitive-related network is not altered by these interventions for PD motor symptoms. This pattern may however change in response to therapies targeting the cognitive symptoms of this disorder. Recent work has focused on the identification of specific network biomarkers for atypical parkinsonian conditions such as multiple system atrophy (MSA) and progressive supranuclear palsy (PSP). These disease-related patterns can potentially be used in an automated imaging-based algorithm to classify patients with these disorders.


Figures

FIG. 1
FIG. 1
Left: Parkinson’s Disease-Related Pattern (PDRP). This motor-related metabolic spatial covariance pattern is characterized by hypermetabolism in the thalamus, globus pallidus (GP), pons, and motor cortex, associated with relative metabolic reductions in the lateral premotor and posterior parietal areas. Right: Parkinson’s Disease-Related Cognitive Pattern (PDCP). This cognition-related metabolic spatial covariance pattern is characterized by hypometabolism of dorsolateral prefrontal cortex, rostral supplementary motor area (preSMA), and superior parietal regions, associated with relative metabolic increases in the cerebellum. [In the representative slices, relative metabolic increases are displayed in red; relative metabolic decreases are displayed in blue. For both patterns, the slices were overlaid on a standard MRI brain template.]
FIG. 2
FIG. 2
Mean network activity at baseline, 24 and 48 months. Z-transformed values for the PD-related motor and cognitive spatial covariance patterns (PDRP and PDCP; see Figure 1) were computed at each timepoint and displayed relative to the mean for 15 age-matched healthy subjects. Network activity increased significantly over time for both patterns, with the PDRP progressing faster than the PDCP. [Bars represent the standard error at each timepoint.] [Brain 130(Part 7), 1834–1846 Copyright © 2007 by Oxford University Press].
FIG. 3
FIG. 3
Bar graph illustrating treatment-mediated changes (±SE) in the expression of the PD-related metabolic covariance pattern. Difference values from the levodopa infusion (LD), STN stimulation (DBS), and the test–retest control (CN) groups are presented in the left panel. These measures were compared with those from previous PET studies of patients with PD undergoing unilateral stereotaxic procedures of the internal globus pallidus (GPi) or the subthalamic nucleus (STN)., The latter data are presented in the right panel. [ON/OFF PDRP differences in the DBS cohorts are displayed as black bars. Treatment-mediated differences in the LD cohort and the stereotaxic lesioning cohorts are displayed as filled and dotted gray bars, respectively. Asterisks represent P-values with respect to the untreated condition (paired Student’s t-test).] *P < 0.05, **P < 0.01.
FIG. 4
FIG. 4
Changes in mean network activity following gene therapy for the operated (filled circles) and the unoperated (open circles) hemispheres. There was a significant difference (P < 0.002) in the time course of PDRP activity across the two hemispheres (left). In the unoperated hemisphere, network activity increased continuously over the 12 months after surgery. By contrast, in the operated hemisphere, a decline in network activity was evident during the first 6 months. Over the subsequent 6 months, network activity on this side increased in parallel with analogous values on the unoperated side. There was no change (P = 0.72) in PDCP activity over time in either of the two hemispheres (right). [The dashed line represents one standard error above the normal mean value of zero]. [Proc Natl Acad Sci USA, 104, 19559–19564 Copyright © 2007 National Academy of Sciences, U.S.A.]
FIG. 5
FIG. 5
Disease-related spatial covariance patterns associated with MSA (left) and PSP (right). For MSA, the disease-related pattern is characterized by covarying metabolic decreases in the putamen and the cerebellum. For PSP, the disease-related pattern is characterized by covarying metabolic decreases in the medial prefrontal cortex (PFC), the frontal eye fields, the ventrolateral prefrontal cortex (VLPFC), the caudate nuclei, the medial thalamus, and the upper brainstem. For both diseases, individual measures of pattern expression (subject scores) accurately discriminated patients from controls in the original network analysis and in prospectively scanned patient and control cohorts. [In the representative slices, relative metabolic decreases are displayed in blue. For both patterns, the slices were overlaid on a standard MRI brain template.] [Revised illustration based on Mov Disord 23: 727–733 Copyright © 2008 John Wiley & Sons Inc.]

References

    1. Mata M, Fink DJ, Gainer H, et al. Activity-dependent energy metabolism in rat posterior pituitary primarily reflects sodium pump activity. J Neurochem. 1980;34:213–215. - PubMed
    1. Schwartz WJ, Smith CB, Davidsen L, et al. Metabolic mapping of functional activity in the hypothalamo-neurohypophysial system of the rat. Science. 1979;205:723–725. - PubMed
    1. Trošt M, Dhawan V, Feigin A, Eidelberg D. PET and SPECT. In: Beal MF, Lang A, Ludolph A, editors. Neurodegenerative diseases: neurobiology pathogenesis and therapeutics. Cambridge University Press; Cambridge: 2005. pp. 290–300.
    1. Habeck C, Stern Y. Neural network approaches and their reproducibility in the study of verbal working memory and Alzheimer’s disease. Clin Neurosci Res. 2007;6:381–390. - PMC - PubMed
    1. Alexander GE, Moeller JR. Application of the scaled subprofile model to functional imaging in neuropsychiatric disorders: a principal component approach to modeling brain function in disease. Hum Brain Mapp. 1994;2:1–16.

Publication types

MeSH terms