. 2010 Feb;9(1):40-53.
doi: 10.1111/j.1474-9726.2009.00532.x. Epub 2009 Oct 30.

Short-term dietary restriction and fasting precondition against ischemia reperfusion injury in mice

Affiliations

Short-term dietary restriction and fasting precondition against ischemia reperfusion injury in mice

James R Mitchell et al. Aging Cell. 2010 Feb.

Abstract

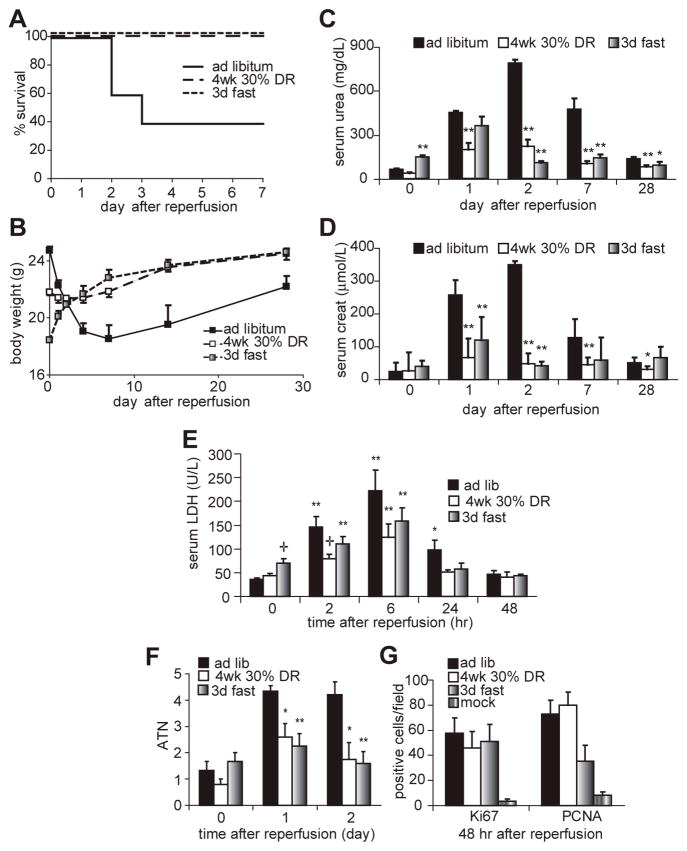
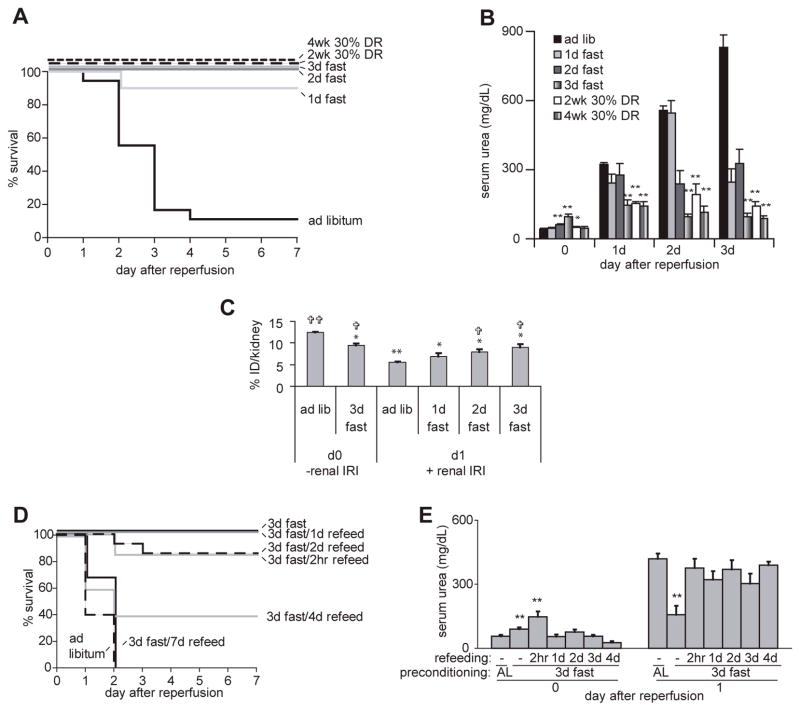
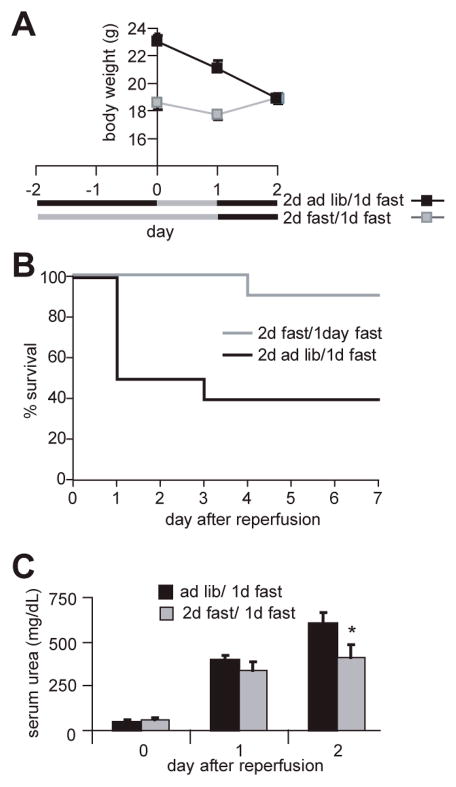
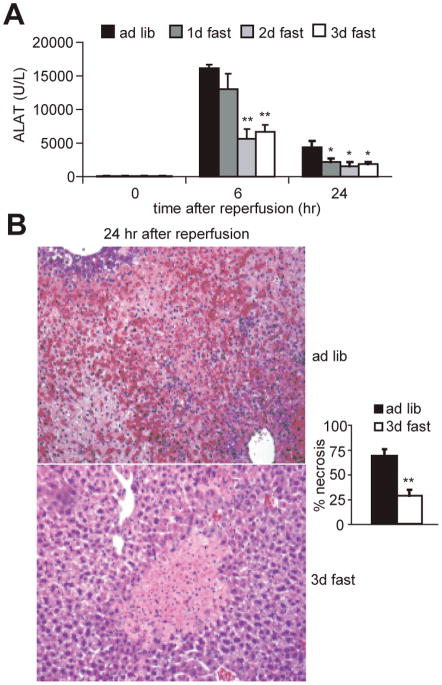
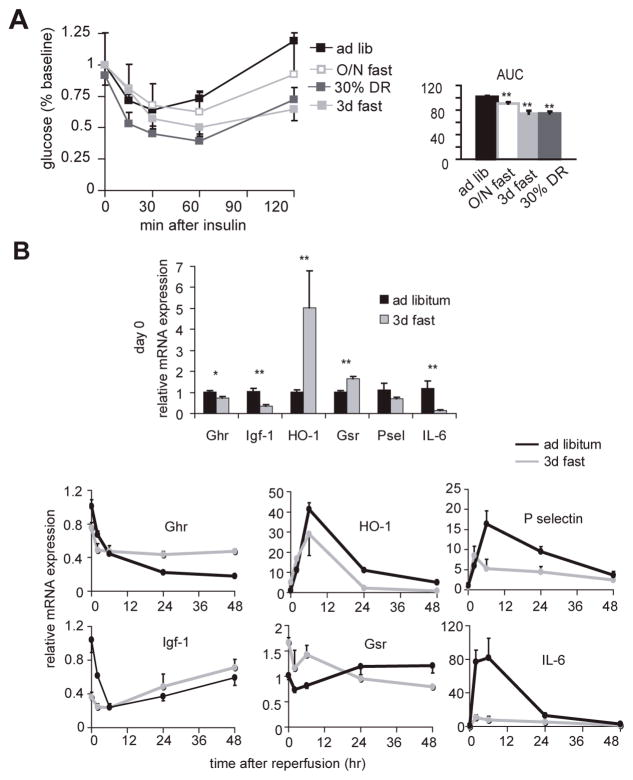
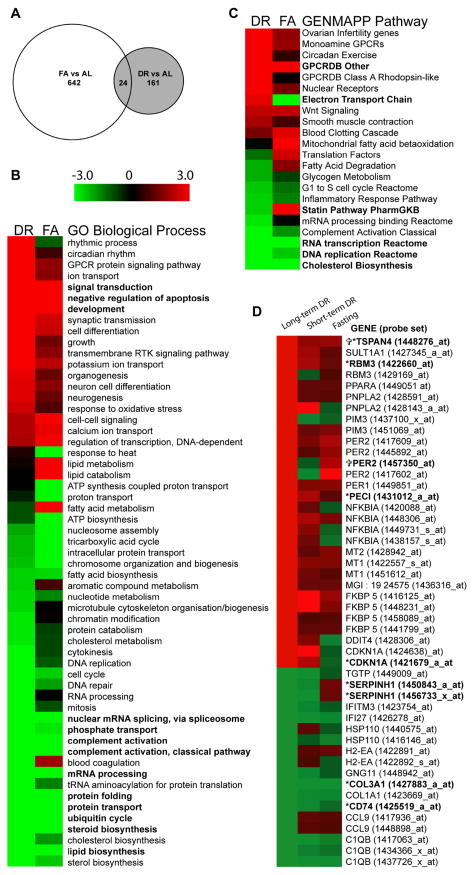
Dietary restriction (DR) extends lifespan and increases resistance to multiple forms of stress, including ischemia reperfusion injury to the brain and heart in rodents. While maximal effects on lifespan require long-term restriction, the kinetics of onset of benefits against acute stress is not known. Here, we show that 2-4 weeks of 30% DR improved survival and kidney function following renal ischemia reperfusion injury in mice. Brief periods of water-only fasting were similarly effective at protecting against ischemic damage. Significant protection occurred within 1 day, persisted for several days beyond the fasting period and extended to another organ, the liver. Protection by both short-term DR and fasting correlated with improved insulin sensitivity, increased expression of markers of antioxidant defense and reduced expression of markers of inflammation and insulin/insulin-like growth factor-1 signaling. Unbiased transcriptional profiling of kidneys from mice subject to short-term DR or fasting revealed a significant enrichment of signature genes of long-term DR. These data demonstrate that brief periods of reduced food intake, including short-term daily restriction and fasting, can increase resistance to ischemia reperfusion injury in rodents and suggest a rapid onset of benefits of DR in mammals.


Figures

Figure 1
Figure 1. DR protects against the damaging effects of renal IRI
A. Survival curves of male mice fed ad libitum, restricted to 70% of ad libitum food consumption for 4 weeks, or fasted for 3 days prior to induction of 37 minutes of bilateral renal IRI (n=10 per group). No further mortality was observed beyond day 4 after surgery. Both dietary treatments led to a significant survival advantage by Kaplan Meier analysis (log rank test, p<0.01). B. Body weight of mice over a 28-day time course following renal IRI. C, D. Kidney function as measured by serum urea (C) and creatinine (D) concentrations on the indicated days following surgery. Asterisks indicate the significance of the difference as compared to the ad libitum group at the same time point (* p<0.05; ** p<0.01). E. Blood serum LDH of the indicated groups over a time course following reperfusion. Asterisks indicate significant differences relative to time 0 of the same treatment; crosses represent significant differences relative to the ad libitum group at the indicated time point. F. Quantification of acute tubular necrosis on a 5 point scale before and after renal IRI based on blind scoring of hemotoxylin/eosin stained kidney sections as described previously (Leemans et al. 2005). Asterisks represent significant differences relative to the ad libitum group at the indicated time point (* p<0.05; ** p<0.01). G. Percentage of cells expressing Ki67 or PCNA proliferative markers in a microscopic field of the indicated group on the second day following IRI. All groups were significantly elevated vs. the mock control.
Figure 2
Figure 2. Rapid onset and loss of protective effects of short-term DR and fasting
A-C. Rapid onset: A. Survival curves of male mice fed ad libitum, 30% restricted for 2–4 weeks, or fasted for 1–3 days prior to induction of 37 minutes of unilateral renal IRI with contralateral nephrectomy (n=10–18 per group). B. Kidney function as measured by serum urea following 37 minutes of unilateral renal IRI in the indicated groups (serum from 4–10 individual animals was sampled per data point). Asterisks indicate the significance of the difference as compared to the ad libitum group at the same time point (** p<0.01). C. Mice fasted for 0–3 days (4–10 animals per group) were analyzed for kidney function either in the absence of renal ischemia (day 0, -renal IRI) or one day following 37 minutes renal ischemia (day 1, +renal IRI) by measuring radioactivity in the kidney with a gamma-counter 4 h after injection of 99mTc-DMSA, expressed as a percentage of the injected dose per one kidney (% ID/kidney). Note the reduced percentage of 99mTc-DMSA in the kidneys of the ad libitum group 24 hours after renal IRI (12.4% to 5.6%), indicative of renal dysfunction. The significance of the difference as compared to the ad libitum group prior to (asterisks) or one day after (crosses) renal IRI is indicated. D, E. Rapid loss: D. Survival curves of the indicated groups. Survival of animals refed for 2hr, 1 and 2 days was significantly different than ad libitum fed animals (p<0.002); survival of animals refed for 4 and 7 days was not significantly different than ad libitum fed animals. E. Kidney function as measured by serum urea prior to and one day following IRI. Data from three independent experiments with 4–12 animals per group are averaged. In the day 0 group asterisks indicate significant differences vs. the ad libitum fed control group; in the day 1 group, asterisks indicate significant difference between 3 days of fasting without refeeding and ad libitum (AL) fed animals as well as each of the refed groups (**p<0.01). There were no significant differences between the ad libitum group and any of the refed groups on day 1 following renal IRI.
Figure 3
Figure 3. Protection is a preconditioning effect
A. Black bars indicate periods of free access to chow; grey bars indicate periods without access to chow. Body weights of the two groups at the time of surgery (day 0) are indicated. Error bars indicating SEM are contained within the symbols. B. Survival following renal IRI; fasted animals retained their survival advantage (p < 0.02) despite lack of refeeding for one day following renal IRI. C. Kidney function as measured by serum urea levels before and after IRI. Asterisk indicates a significant difference between the fasted and ad libitum fed groups (p<0.05) on the second day following surgery.
Figure 4
Figure 4. Dietary preconditioning in the liver
A. Reduced injury markers upon liver IRI in fasted mice. Mice (5–8 animals per group) were fasted for the indicated times prior to induction of 75 minutes of warm ischemia to the liver. Serum concentration of the liver-specific enzyme alanine aminotransferase (ALAT) indicative of liver damage was measured at the indicated times following reperfusion. Asterisks indicate the significance of the difference as compared to the ad libitum group at the same time point using a Mann-Whitney U-test (* p<0.05; ** p<0.01). B. Representative hematoxylin/eosin-stained liver sections from mice 24 hours after reperfusion Note the large areas of hemorrhagic necrosis (in red) in the mouse fed ad libitum prior to IRI and its relative absence in the mouse fasted for 3 days prior. Magnification 100X. Right: Quantification of hemorrhagic necrosis. Liver necrosis was scored blindly on a scale from 0–4, with 4 representing 100% of the area covered by hemorrhagic necrosis. Asterisks indicate the significance of the difference as compared to the ad libitum group (** p<0.01).
Figure 5
Figure 5. Insulin and IGF-1 signaling in dietary preconditioning
A. Improved insulin sensitivity in preconditioned mice. Whole blood glucose levels at the indicated timepoints following intraperitoneal injection of insulin into animals following the indicated preconditioning regimens. Right: area under the curves (AUC). Statistically significant differences relative to the ad libitum group are indicated by asterisks (** p<0.01; * p<0.05). B. Differential expression of markers of antioxidant protection, inflammation and GH/IGF-1 axis. Changes in steady state mRNA levels of the indicated genes at baseline (bar graph, top) and over a two day time course following reperfusion (line graphs, bottom) as determined by quantitative real-time PCR. All data points are expressed relative to the ad libitum group at t=0 prior to renal IR. Each data point represents the mean expression value from 5 animals. HO-1, hemeoxygenase-1; Gsr, glutathione reductase; IL-6, interleukin-6; Ghr, growth hormone receptor; Igf-1, insulin-like growth factor-1. Top: asterisks indicate the significance of the difference as compared to the ad libitum group (* p<0.05; ** p<0.01).
Figure 6
Figure 6. Global transcriptional changes upon short-term dietary restriction and fasting
A. Venn diagram representing numbers and overlap of probesets significantly differentially regulated in kidney as a result of dietary preconditioning (4 wk 30% DR or 3 days fasting, FA) as compared to ad libitum fed controls. Significance cutoffs were set by fold change of greater than 1.5 and p value of <0.001. B, C. All Gene Ontology - Biological Processes (B) and GENMAPP Pathway (C) gene sets over-represented within either the short-term DR or fasted vs. ad libitum data sets were aligned according to Z score. Red, green and black indicate upregulation, downregulation and or no change, respectively, of that biological process due to the given dietary treatment relative to ad libitum feeding. Gene sets are ordered by Z score of the 30% DR group. Note that all gene sets significantly over-represented in either treatment group (DR or FA) are included in the heat maps, and that those gene sets significantly over-represented in both treatment groups are in bold. D. Similarity to long-term DR. Heat map of gene expression changes in a pre-defined set of 28 genes comprising a common transcriptional signature of DR across multiple mouse tissues (Swindell 2008). Long-term DR probesets are indicated either as up (red) or down (green) without regard to magnitude of expression; probesets corresponding to short-term DR and fasted groups are colored as in B. Significant genes from the short-term DR and fasted data sets as defined by fold change > 1.5 and p value <0.001 are in bold, with crosses and asterisks corresponding to short-term DR and fasting, respectively.

Similar articles

Cited by

References

    1. Ahmet I, Wan R, Mattson MP, Lakatta EG, Talan M. Cardioprotection by intermittent fasting in rats. Circulation. 2005;112:3115–21. - PubMed
    1. Anson RM, Guo Z, de Cabo R, Iyun T, Rios M, Hagepanos A, Ingram DK, Lane MA, Mattson MP. Intermittent fasting dissociates beneficial effects of dietary restriction on glucose metabolism and neuronal resistance to injury from calorie intake. Proc Natl Acad Sci U S A. 2003;100:6216–20. - PMC - PubMed
    1. Bishop NA, Guarente L. Genetic links between diet and lifespan: shared mechanisms from yeast to humans. Nat Rev Genet. 2007;8:835–44. - PubMed
    1. Brown-Borg HM. Longevity in mice: is stress resistance a common factor? AGE. 2006;28:145–162. - PMC - PubMed
    1. Chandrasekar B, Nelson JF, Colston JT, Freeman GL. Calorie restriction attenuates inflammatory responses to myocardial ischemia-reperfusion injury. Am J Physiol Heart Circ Physiol. 2001;280:H2094–102. - PubMed

Publication types

MeSH terms