Comparative Study
. 2009 Oct 30:8:56.
doi: 10.1186/1475-2840-8-56.

Nitric oxide and superoxide dismutase modulate endothelial progenitor cell function in type 2 diabetes mellitus

Affiliations
Comparative Study

Nitric oxide and superoxide dismutase modulate endothelial progenitor cell function in type 2 diabetes mellitus

Saher Hamed et al. Cardiovasc Diabetol. .

Abstract

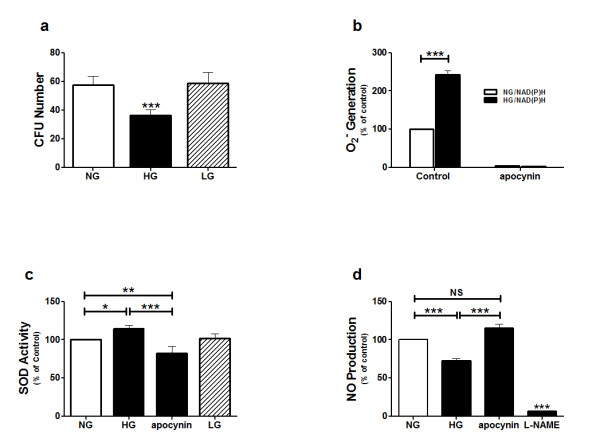
Background: The function of endothelial progenitor cells (EPCs), which are key cells in vascular repair, is impaired in diabetes mellitus. Nitric oxide (NO) and reactive oxygen species can regulate EPC functions. EPCs tolerate oxidative stress by upregulating superoxide dismutase (SOD), the enzyme that neutralizes superoxide anion (O2-). Therefore, we investigated the roles of NO and SOD in glucose-stressed EPCs.

Methods: The functions of circulating EPCs from patients with type 2 diabetes were compared to those from healthy individuals. Healthy EPCs were glucose-stressed, and then treated with insulin and/or SOD. We assessed O2- generation, NO production, SOD activity, and their ability to form colonies.

Results: EPCs from diabetic patients generated more O2-, had higher NAD(P)H oxidase and SOD activity, but lower NO bioavailability, and expressed higher mRNA and protein levels of p22-phox, and manganese SOD and copper/zinc SOD than those from the healthy individuals. Plasma glucose and HbA1c levels in the diabetic patients were correlated negatively with the NO production from their EPCs. SOD treatment of glucose-stressed EPCs attenuated O2- generation, restored NO production, and partially restored their ability to form colonies. Insulin treatment of glucose-stressed EPCs increased NO production, but did not change O2- generation and their ability to form colonies. However, their ability to produce NO and to form colonies was fully restored after combined SOD and insulin treatment.

Conclusion: Our data provide evidence that SOD may play an essential role in EPCs, and emphasize the important role of antioxidant therapy in type 2 diabetic patients.


Figures

Figure 1
Figure 1
Endothelial progenitor cell characterization. Endothelial progenitor cells (EPCs) were cultured for five days. (a) From left to right, Panel 1: acetylated LDL uptake by adherent spindle-shaped EPCs, FITC-conjugated lectin UEA-1 binding to the surface of EPCs, and double-positive stained EPCs for acetylated LDL uptake and lectin binding. Panel 2: Immunofluorescence detection of the CD34 antigen (red), and KDR (green) on the EPC surface. Panel 3: Immunofluorescence detection of eNOS in a single non-stained EPC (green). Panel 4: Immunofluorescence detection of the CD34 antigen on the EPC surface (red), and eNOS (green). The EPC nuclei were stained with the blue fluorescent DNA dye DRAQ5™. Scale bare 50 μm. (b) A representative colony of EPCs with a central core of round cells that is surrounded by elongated spindle-shaped cells. Scale bare 100 μm.
Figure 2
Figure 2
Endothelial progenitor cell number and function. Endothelial progenitor cells (EPCs) from diabetic patients and healthy individuals were cultured for five days. (a) Circulating EPCs were labeled with CD34 and KDR cell surface antigens, and then identified by flow cytometry. The bars represent the number of circulating EPCs in the two study groups. (b) The numbers of colony-forming units (CFUs) of EPCs were counted manually in the two study groups. (c) Nitric oxide (NO) content in the medium was determined by measuring the intensity of DAF-2 fluorescence in the EPC culture medium. (d) NAD(P)H oxidase activity in EPCs from type 2 diabetes patients and healthy individuals and (e) Superoxide anion (O2-) generation by EPCs from type 2 diabetic patients and healthy individuals were measured by the lucigenin-enhanced chemiluminescence assay. (f) SOD activity in EPCs of type 2 diabetic patients and healthy individuals. The results in c, d, e, and f are expressed as a percentage of fluorescence intensity of the healthy group. Data are expressed as mean or percentage ± SEM. *P < 0.05, **P < 0.01, ***P < 0.001. DM represents diabetic patients.
Figure 3
Figure 3
mRNA and protein expression of SODs and p22-phox in EPCs. Total RNA and protein of EPCs from type 2 diabetic patients and healthy volunteers were isolated and the mRNA and the protein expressions of a membrane-bound component of NAD(P)H oxidase; p22-phox and the antioxidant enzymes; Cu/ZnSOD, and MnSOD were assessed. (a) Comparison of mRNA expression between p22-phox, Cu/ZnSOD, and MnSOD in EPCs of healthy volunteers (white bars) and type 2 diabetic patients (black bars). (b) Comparison of protein expression between p22-phox, Cu/ZnSOD, and MnSOD in EPCs of healthy volunteers (white bars) and type 2 diabetic patients (black bars). (c) Representative bolts. Blots were scanned and expression of p22-phox, Cu/ZnSOD, and MnSOD was quantified by densitometric analysis and normalized with β-actin. Data are expressed as mean or percentage ± SEM. *P < 0.05, **P < 0.01, ***P < 0.001. DM represents diabetic patients.
Figure 4
Figure 4
Relationship between NO production and O2-generation by EPCs, and the plasma glucose and HbA1c levels in type 2 diabetic patients. (a) Scatter plot of the relationship between NO production and O2- generation by EPCs from type 2 diabetic patients and the individual patient's plasma glucose and HbA1c levels at the time of blood collection. (b) Scatter plot of the relationship between SOD activity in EPCs from type 2 diabetic patients and O2- generation, and NO production of their EPCs.
Figure 5
Figure 5
Effect of individual risk factors and medications on NO production from EPCs. (a) Effect of individual risk factors on NO production by EPCs of all diabetic patients. (b) Association between the individual medications that was taken by the type 2 diabetic patients and NO production by their EPCs. Increased NO production by EPCs was associated with the use of statins only. Data are expressed as mean percentage ± SEM. *P < 0.05, **P < 0.01.
Figure 6
Figure 6
Assessment of glucose-stressed EPC cultures. (a) Number of colonies (CFUs) of non-stressed EPCs (normal glucose (5 mmol/L) (NG)), glucose-stressed EPCs (25 mmol/L D-glucose (HG)), and an osmolarity control (25 mmol/L L-glucose (LG)). (b) Superoxide anion (O2-) generation in non-stressed and glucose-stressed EPCs in the absence or presence of apocynin. (c) SOD activity in non-stressed EPCs (NG), glucose-stressed EPCs (HG), glucose-stressed EPCs treated with apocynin, and an osmolarity control (25 mmol/L L-glucose (LG)). (d) NO levels in non-stressed EPCs (NG), glucose-stressed EPCs (HG), glucose-stressed EPCs after being treated with apocynin, an inhibitor of NAD(P)H oxidase, and glucose-stressed EPCs after being treated with L-NAME, a non-specific inhibitor of NOS. Data are expressed as mean percentage ± SEM or mean number ± SEM of triplicate measurements in each sample from four independent tests. *P < 0.05, **P < 0.01, ***P < 0.001 vs. non-stressed EPCs (control). NS represents non-significant.
Figure 7
Figure 7
Insulin and SOD effects on glucose-stressed EPC cultures. Glucose-stressed EPCs were treated with insulin, SOD, or both. (a) Effect of insulin, SOD, or both on NO production. (b) Effect of insulin, SOD, or both on O2- generation. (c) Effect of insulin, SOD, or both on the number of EPC colonies. Data are expressed as mean percentage ± SEM or mean number ± SEM of triplicate measurements in each sample from four independent tests. *P < 0.05, **P < 0.001, ***P < 0.001 vs. glucose-stressed EPCs. NS represents non-significant.

References

    1. Schaumberg DA, Glynn RJ, Jenkins AJ, Lyons TJ, Rifai N, Manson JE, Ridker PM, Nathan DM. Effect of intensive glycemic control on levels of markers of inflammation in type 1 diabetes mellitus in the diabetes control and complications trial. Circulation. 2005;111:2446–2453. doi: 10.1161/01.CIR.0000165064.31505.3B. - DOI - PubMed
    1. Hirschi KK, Ingram DA, Yoder MC. Assessing identity, phenotype, and fate of endothelial progenitor cells. Arterioscler Thromb Vasc Biol. 2008;28:1584–1595. doi: 10.1161/ATVBAHA.107.155960. - DOI - PMC - PubMed
    1. Fadini GP, Agostini C, Avogaro A. Endothelial progenitor cells and vascular biology in diabetes mellitus: current knowledge and future perspectives. Curr Diabetes Rev. 2005;1:41–58. doi: 10.2174/1573399052952640. - DOI - PubMed
    1. Tepper OM, Galiano RD, Capla JM, Kalka C, Gagne PJ, Jacobowitz GR. Human endothelial progenitor cells from type II diabetics exhibit impaired proliferation, adhesion, and incorporation into vascular structures. Circulation. 2002;106:2781–2786. doi: 10.1161/01.CIR.0000039526.42991.93. - DOI - PubMed
    1. Galasso G, Schiekofer S, Sato K, Shibata R, Handy DE, Ouchi N. Impaired angiogenesis in glutathione peroxidase-1-deficient mice is associated with endothelial progenitor cell dysfunction. Circ Res. 2006;98:254–261. doi: 10.1161/01.RES.0000200740.57764.52. - DOI - PMC - PubMed

Publication types