

Vulnerability of postnatal hippocampal neurons to seizures varies regionally with their maturational stage
- PMID: 19879360
- PMCID: PMC2818381
- DOI: 10.1016/j.nbd.2009.10.019
Vulnerability of postnatal hippocampal neurons to seizures varies regionally with their maturational stage
Abstract
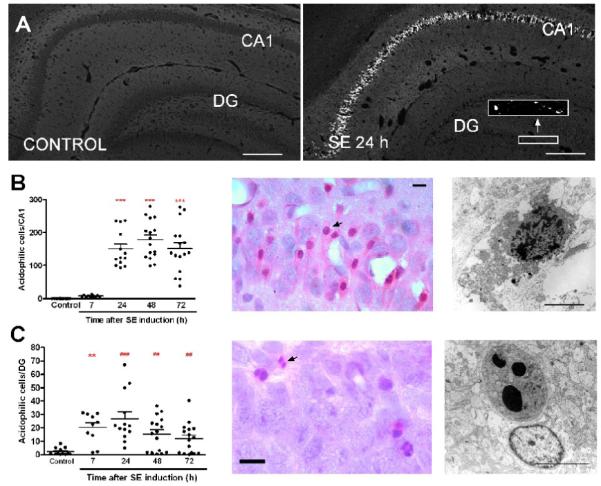
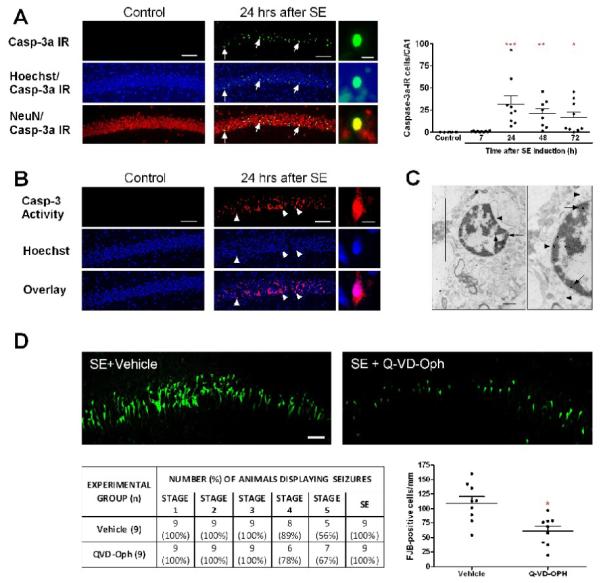
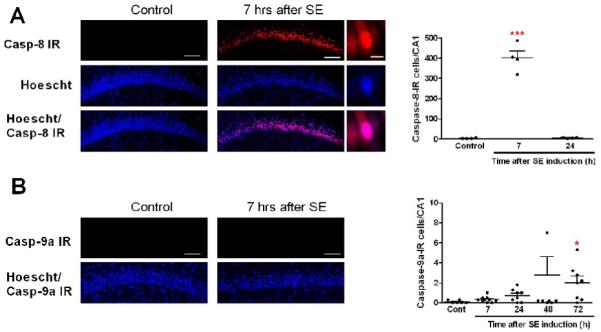
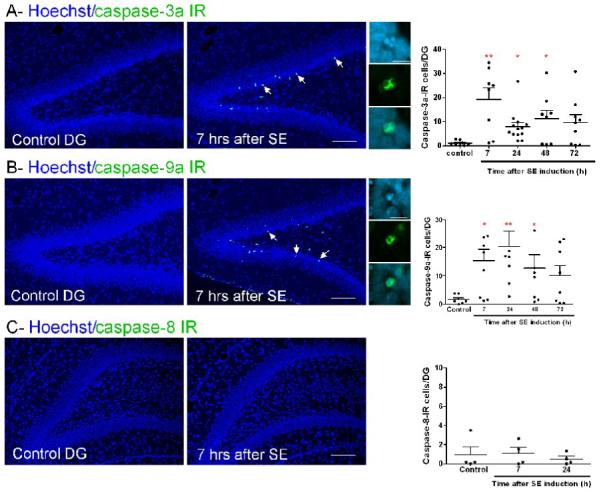
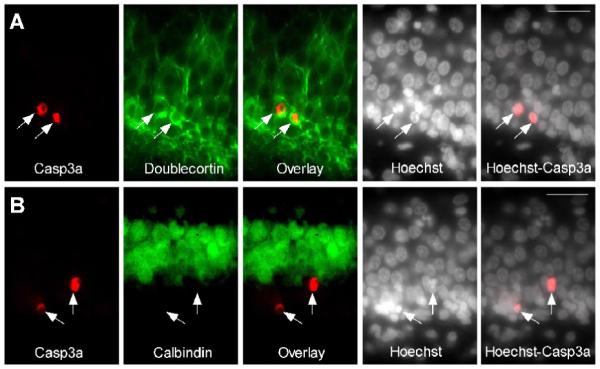
The mechanism of status epilepticus-induced neuronal death in the immature brain is not fully understood. In the present study, we examined the contribution of caspases in our lithium-pilocarpine model of status epilepticus in 14 days old rat pups. In CA1, upregulation of caspase-8, but not caspase-9, preceded caspase-3 activation in morphologically necrotic cells. Pretreatment with a pan-caspase inhibitor provided neuroprotection, showing that caspase activation was not an epiphenomenon but contributed to neuronal necrosis. By contrast, upregulation of active caspase-9 and caspase-3, but not caspase-8, was detected in apoptotic dentate gyrus neurons, which were immunoreactive for doublecortin and calbindin-negative, two features of immature neurons. These results suggest that, in cells which are aligned in series as parts of the same excitatory hippocampal circuit, the same seizures induce neuronal death through different mechanisms. The regional level of neuronal maturity may be a determining factor in the execution of a specific death program.
Figures
Similar articles
-
Distinct caspase pathways mediate necrosis and apoptosis in subpopulations of hippocampal neurons after status epilepticus.Epilepsia. 2010 Jul;51 Suppl 3(Suppl 3):56-60. doi: 10.1111/j.1528-1167.2010.02611.x. Epilepsia. 2010. PMID: 20618402 Free PMC article.
-
Pathogenesis of hippocampal neuronal death after hypoxia-ischemia changes during brain development.Neuroscience. 2004;127(1):113-23. doi: 10.1016/j.neuroscience.2004.03.062. Neuroscience. 2004. PMID: 15219674 Free PMC article.
-
The spiny rat Proechimys guyannensis as model of resistance to epilepsy: chemical characterization of hippocampal cell populations and pilocarpine-induced changes.Neuroscience. 2001;104(4):979-1002. doi: 10.1016/s0306-4522(01)00138-5. Neuroscience. 2001. PMID: 11457585
-
Vascular changes in epilepsy: functional consequences and association with network plasticity in pilocarpine-induced experimental epilepsy.Neuroscience. 2010 Mar 10;166(1):312-32. doi: 10.1016/j.neuroscience.2009.12.002. Epub 2009 Dec 23. Neuroscience. 2010. PMID: 20004712
-
Inflammation contributes to seizure-induced hippocampal injury in the neonatal rat brain.Acta Neurol Scand Suppl. 2007;186:16-20. Acta Neurol Scand Suppl. 2007. PMID: 17784532
Cited by
-
Widespread neuronal injury in a model of cholinergic status epilepticus in postnatal day 7 rat pups.Epilepsy Res. 2016 Feb;120:47-54. doi: 10.1016/j.eplepsyres.2015.11.005. Epub 2015 Nov 12. Epilepsy Res. 2016. PMID: 26709882 Free PMC article.
-
Morphological study of the postnatal hippocampal development in the TRPV1 knockout mice.Temperature (Austin). 2023 Feb 3;10(1):102-120. doi: 10.1080/23328940.2023.2167444. eCollection 2023. Temperature (Austin). 2023. PMID: 37187833 Free PMC article.
-
Simultaneous triple therapy for the treatment of status epilepticus.Neurobiol Dis. 2017 Aug;104:41-49. doi: 10.1016/j.nbd.2017.04.019. Epub 2017 Apr 29. Neurobiol Dis. 2017. PMID: 28461248 Free PMC article.
-
Differentiating neurons derived from human umbilical cord blood stem cells work as a test system for developmental neurotoxicity.Mol Neurobiol. 2015 Apr;51(2):791-807. doi: 10.1007/s12035-014-8716-7. Epub 2014 May 24. Mol Neurobiol. 2015. PMID: 24859382
-
Microglia and status epilepticus in the immature brain.Epilepsia Open. 2023 May;8 Suppl 1(Suppl 1):S73-S81. doi: 10.1002/epi4.12610. Epub 2022 May 17. Epilepsia Open. 2023. PMID: 35531942 Free PMC article. Review.
References
-
- Altman J, Bayer SA. Migration and distribution of two populations of hippocampal granule cell precursors during the perinatal and postnatal periods. J. Comp. Neurol. 1990;30:365–81. - PubMed
-
- Bekenstein JW, Lothman EW. An in vivo study of the ontogeny of long-term potentiation (LTP) in the CA1 region and in the dentate gyrus of the rat hippocampal formation. Brain Res. Dev. 1991a;63:245–51. - PubMed
-
- Bekenstein JW, Lothman EW. A comparison of the ontogeny of excitatory and inhibitory neurotransmission in the CA1 region and dentate gyrus of the rat hippocampal formation. Dev. Brain Res. 1991b;63:237–43. - PubMed
-
- Benjelloun N, Renolleau S, Represa A, Ben-Ari Y, Charriaut-Marlangue C. Inflammatory responses in the cerebral cortex after ischemia in the P7 neonatal Rat. Stroke. 1999;30:1916–23. - PubMed
-
- Carloni S, Carnevali A, Cimino M, Balduini W. Extended role of necrotic cell death after hypoxia-ischemia-induced neurodegeneration in the neonatal rat. Neurobiol Dis. 2007;27:354–61. - PubMed
Publication types
MeSH terms
Substances
Grants and funding
LinkOut - more resources
Full Text Sources
Medical
Research Materials
Miscellaneous
