. 2010 Jan 29;395(4):860-70.
doi: 10.1016/j.jmb.2009.10.052. Epub 2009 Oct 30.

Evolution of protein binding modes in homooligomers

Affiliations

Evolution of protein binding modes in homooligomers

Judith E Dayhoff et al. J Mol Biol. .

Abstract

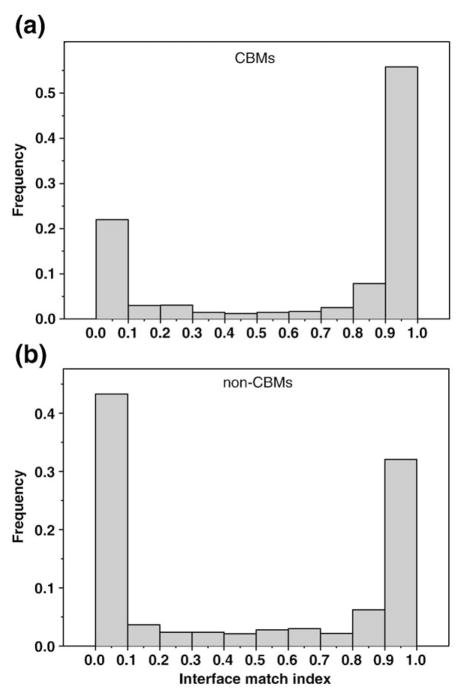
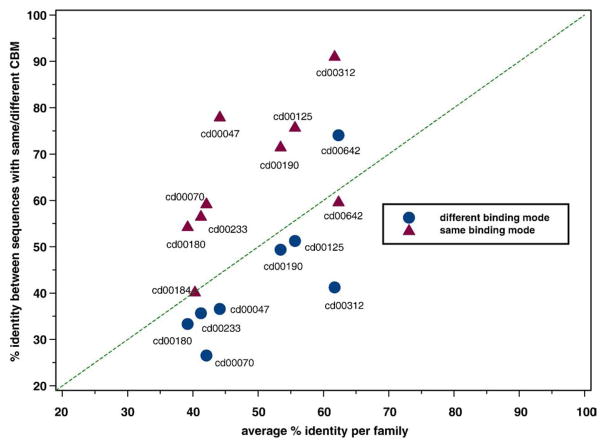
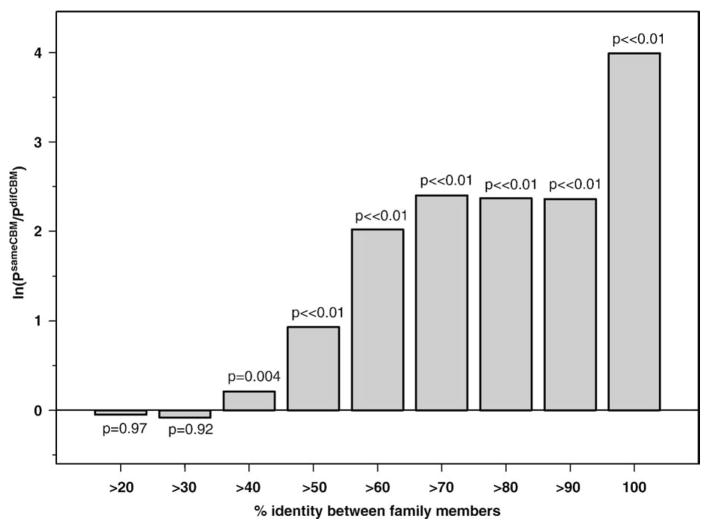
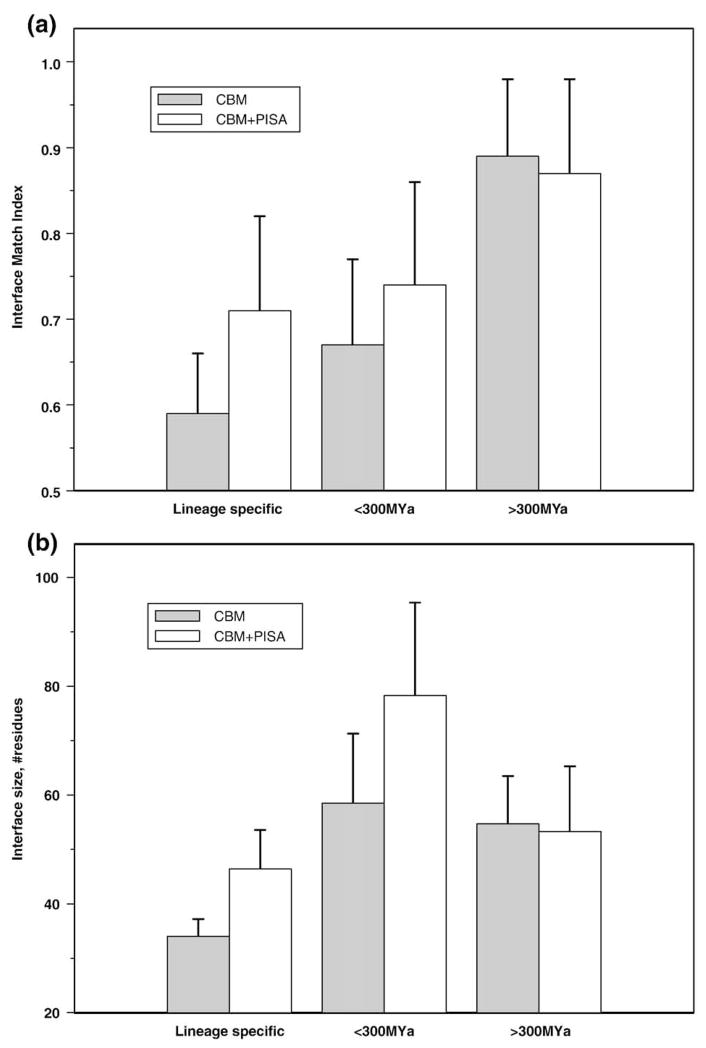
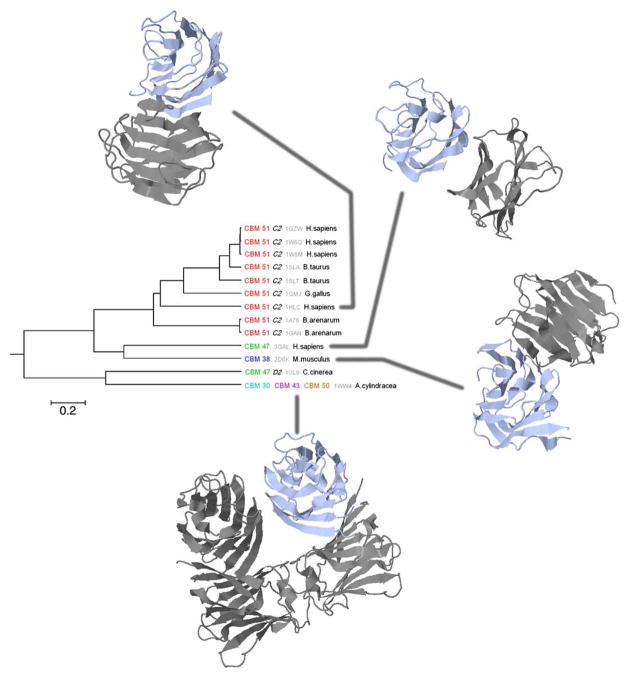
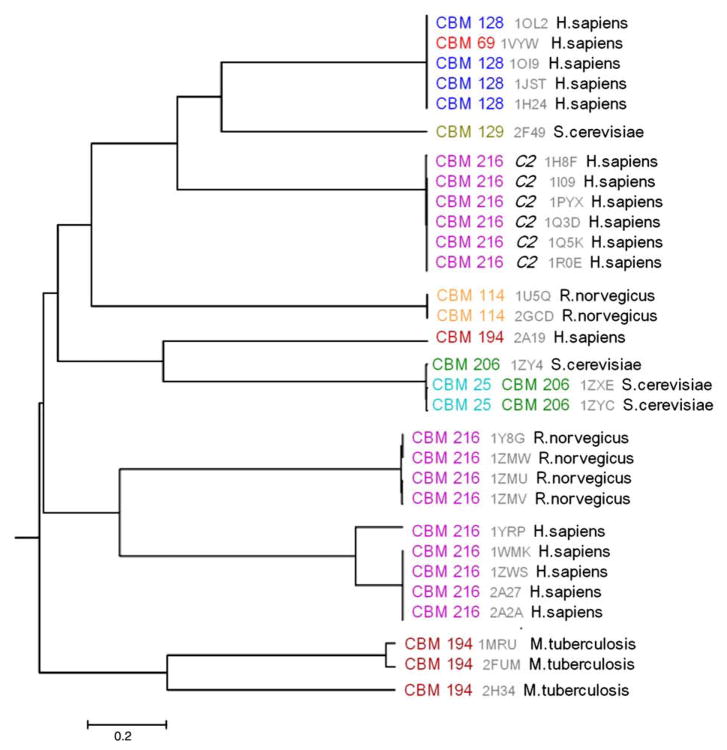
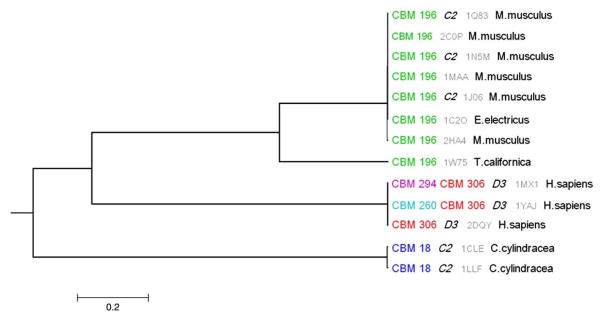
The evolution of protein interactions cannot be deciphered without a detailed analysis of interaction interfaces and binding modes. We performed a large-scale study of protein homooligomers in terms of their symmetry, interface sizes, and conservation of binding modes. We also focused specifically on the evolution of protein binding modes from nine families of homooligomers and mapped 60 different binding modes and oligomerization states onto the phylogenetic trees of these families. We observed a significant tendency for the same binding modes to be clustered together and conserved within clades on phylogenetic trees; this trend is especially pronounced for close homologs with 70% sequence identity or higher. Some binding modes are conserved among very distant homologs, pointing to their ancient evolutionary origin, while others are very specific for a certain phylogenetic group. Moreover, we found that the most ancient binding modes have a tendency to involve symmetrical (isologous) homodimer binding arrangements with larger interfaces, while recently evolved binding modes more often exhibit asymmetrical arrangements and smaller interfaces.


Figures

Fig. 1
Fig. 1
The histogram of IMI for homooligomers from the overall database for conserved binding modes (a) and nonconserved binding modes (b).
Fig. 2
Fig. 2
Average sequence identity between sequences with the same (red triangles) or different (blue circles) conserved binding modes within a given family plotted against the average sequence identity of a family (for cd00184, all chains have at least one common conserved binding mode; no blue circle).
Fig. 3
Fig. 3
Logarithm of probability ratio for finding the same or different conserved binding modes on a pair of family members from a given bin of sequence identity between them. The first bin includes all members from nine families with more than 20% identity between them; the last bin includes sequence-identical family members. The probabilities of observing a given number (or higher) of sequence pairs with the same binding modes purely by chance were calculated from the binomial distribution and shown above each bar.
Fig. 4
Fig. 4
The average IMI (a) and interface size (b) are plotted versus evolutionary age for each conserved binding mode. Evolutionary age is defined as divergence time between the most remotely related species with a given binding mode. Three categories are shown: “>300MYa”—corresponding to those binding modes found in species that diverged from each other more than 300MYa “<300MYa”—binding modes found in more than one species diverged less than 300MYa; and “lineage specific”—binding modes found in one species only. Interactions verified by conserved binding mode analysis are shown in gray (38, 10, and 10 data points in each bin, respectively). Empty boxes show results for those structures where PISA provided an oligomeric state assignment and was in agreement with conserved binding modes (13, 6, and 9, observations in each bin, respectively).
Fig. 5
Fig. 5
Phylogenetic tree for the galectin family (cd00070) with conserved binding mode identifiers and taxonomy annotations.
Fig. 6
Fig. 6
Phylogenetic tree for the serine/threonine protein kinases (cd00180) with conserved binding mode identifiers and taxonomy annotations.
Fig. 7
Fig. 7
Phylogenetic tree for the esterase/lipase family (cd00312) with conserved binding mode identifiers and taxonomy annotations.

References

    1. Mon od J. In: Symmetry and Function of Biological Systems at the Macromolecular Level. Engstrom ASB, editor. Wiley; New York, NY: 1969.
    1. Bahadur RP, Chakrabarti P, Rodier F, Janin J. Dissecting subunit interfaces in homodimeric proteins. Proteins. 2003;53:708–719. - PubMed
    1. Ali MH, Imperiali B. Protein oligomerization: how and why. Bioorg Med Chem. 2005;13:5013–5020. - PubMed
    1. Ponstingl H, Kabir T, Gorse D, Thornton JM. Morphological aspects of oligomeric protein structures. Prog Biophys Mol Biol. 2005;89:9–35. - PubMed
    1. Janin J, Rodier F. Protein–protein interaction at crystal contacts. Proteins. 1995;23:580–587. - PubMed

Publication types

MeSH terms

LinkOut - more resources