

Effects of simplifying choice tasks on estimates of taste heterogeneity in stated-choice surveys
- PMID: 19880234
- PMCID: PMC3152257
- DOI: 10.1016/j.socscimed.2009.10.021
Effects of simplifying choice tasks on estimates of taste heterogeneity in stated-choice surveys
Abstract
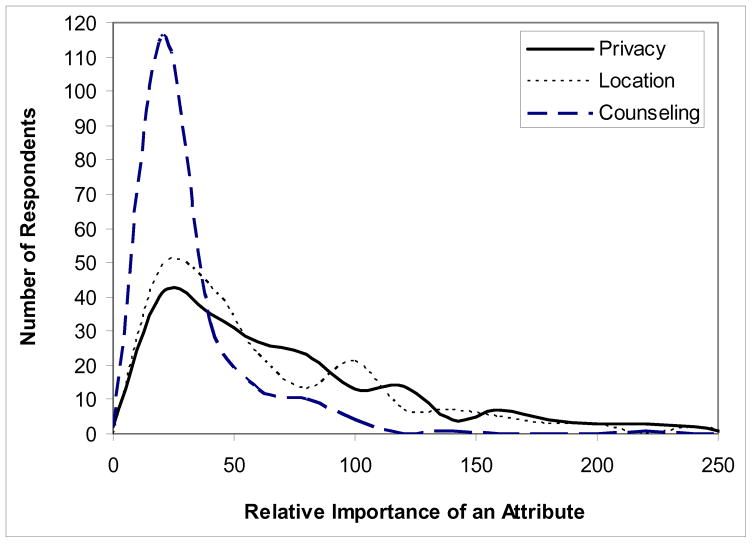
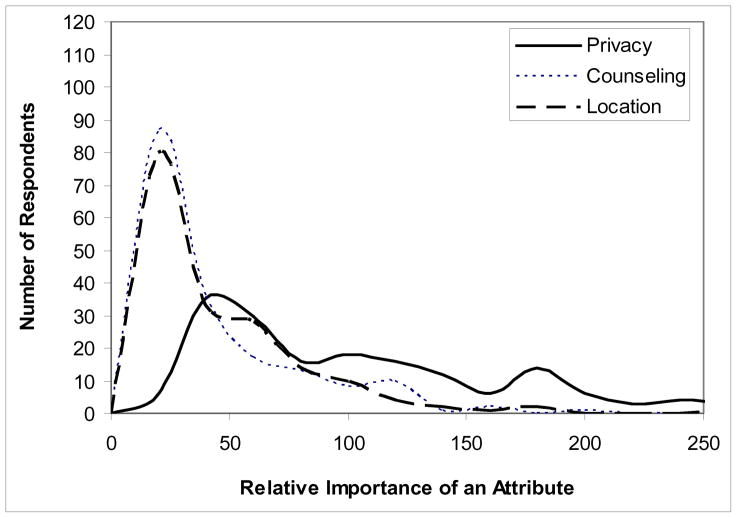
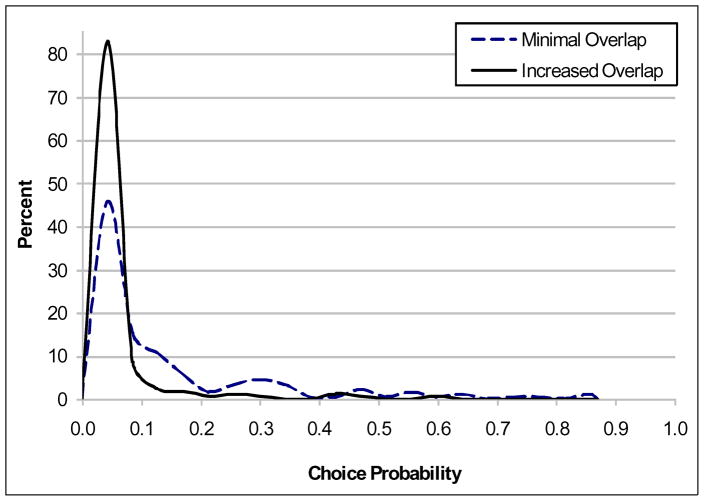
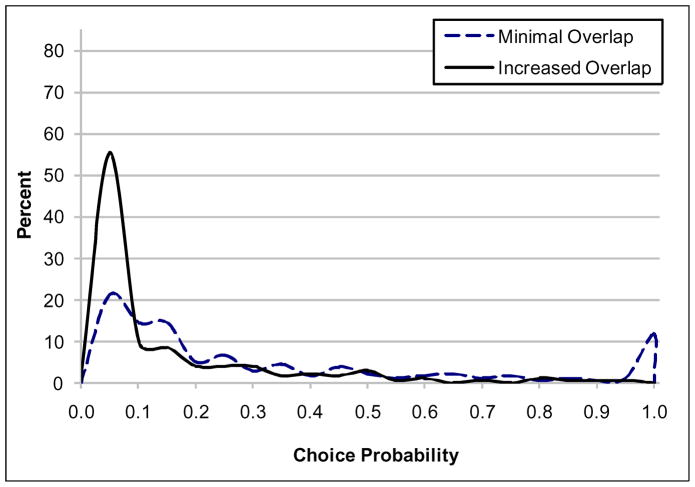
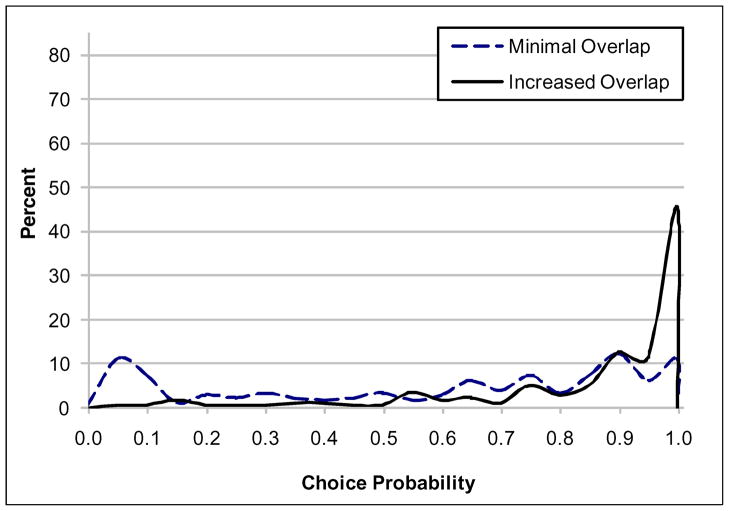
Researchers usually employ orthogonal arrays or D-optimal designs with little or no attribute overlap in stated-choice surveys. The challenge is to balance statistical efficiency and respondent burden to minimize the overall error in the survey responses. This study examined whether simplifying the choice task, by using a design with more overlap, provides advantages over standard minimum-overlap methods. We administered two designs for eliciting HIV test preferences to split samples. Surveys were undertaken at four HIV testing locations in San Francisco, California. Personal characteristics had different effects on willingness to pay for the two treatments, and gains in statistical efficiency in the minimal-overlap version more than compensated for possible imprecision from increased measurement error.
Copyright 2009 Elsevier Ltd. All rights reserved.
Figures
References
-
- Arentze TA, Borgers A, Delmistro R, Timmermans H. Transport stated choice responses: effects of task complexity, presentation format and literacy. Transport Research E. 2003;39:229 – 244.
-
- Bhat C. Accommodating variations in responsiveness to level-of-service variables in travel mode choice modeling. Transportation Research Part A. 1998;32(7):495–507.
-
- Bhat C. Incorporating observed and unobserved heterogeneity in urbanwork mode choice modeling. Transportation Science. 2000;34(2):228–238.
-
- Bennett J, Adamowicz V. Some fundamentals of environmental choice modeling. In: Bennett J, Blamey R, editors. The Choice Modeling Approach to Environmental Valuation. Cheltenham: Edward Elgar; 2001.
-
- Bradley MA, Daly AJ. Use of the logit scaling approach to test rank-order and fatigue effects in stated preference data. Transportation. 1994;21(2):167–184.
Publication types
MeSH terms
Grants and funding
LinkOut - more resources
Full Text Sources
