. 2009 Dec 24;114(27):5454-63.
doi: 10.1182/blood-2009-08-232967. Epub 2009 Oct 30.

Antibody-mediated B-cell depletion before adoptive immunotherapy with T cells expressing CD20-specific chimeric T-cell receptors facilitates eradication of leukemia in immunocompetent mice

Affiliations

Antibody-mediated B-cell depletion before adoptive immunotherapy with T cells expressing CD20-specific chimeric T-cell receptors facilitates eradication of leukemia in immunocompetent mice

Scott E James et al. Blood. .

Abstract

We have established a model of leukemia immunotherapy using T cells expressing chimeric T-cell receptors (cTCRs) targeting the CD20 molecule expressed on normal and neoplastic B cells. After transfer into human CD20 (hCD20) transgenic mice, cTCR(+) T cells showed antigen-specific delayed egress from the lungs, concomitant with T-cell deletion. Few cTCR(+) T cells reached the bone marrow (BM) in hCD20 transgenic mice, precluding effectiveness against leukemia. Anti-hCD20 antibody-mediated B-cell depletion before adoptive T-cell therapy permitted egress of mouse CD20-specific cTCR(+) T cells from the lungs, enhanced T-cell survival, and promoted cTCR(+) T cell-dependent elimination of established mouse CD20(+) leukemia. Furthermore, CD20-specific cTCR(+) T cells eliminated residual B cells refractory to depletion with monoclonal antibodies. These findings suggest that combination of antibody therapy that depletes antigen-expressing normal tissues with adoptive T-cell immunotherapy enhances the ability of cTCR(+) T cells to survive and control tumors.


Figures

Figure 1
Figure 1
Expression of CD20 on normal B cells promotes deletion of CD20-specific cTCR+ T cells. (A-B) Thy1.1+Leu16+ polyclonal effector T cells (107) were injected intravenously into Thy1.2+ WT or hCD20 mice. Spleens were obtained 7 days later and analyzed for donor T cells and endogenous B cells (B). Numbers under boxes in panel A represent the percentage of Thy1.1+ T cells of blood CD4 or CD8 T cells. (C-D) WT mice were injected with 107 Thy1.1+Leu16+CD8+ T cells. Twenty-four hours later, the mice were challenged with 2 × 10⁷ WT or hCD20 splenocytes. (C) Three days later blood was analyzed for donor Thy1.1+ T cells. (D) Spleens were obtained 7 days after challenge and analyzed for donor T cells. Bar graphs represent mean ± SE. Data are representative of 2 experiments with 3 mice per group. P values were obtained with t tests.
Figure 2
Figure 2
Expression of CD20 on normal B cells severely inhibits the in vivo antileukemic function of CD20-specific cTCR+ T cells. (A) WT or hCD20 mice were injected intravenously with 2 × 10⁷ BM185-hCD20/Thy1.1-ffLuc-Neo leukemia cells and treated with 107 Leu16 cTCR or empty vector–transduced Thy1.1+CD8+ T cells 3 days later. Serial quantitative bioluminescent imaging was performed. (B) Bioluminescent images of mice. Two-minute acquisitions are shown, but shorter acquisitions were performed for signal quantitation of mice that saturated the detector. Images were assembled with the use of Illustrator (Adobe Systems). (C) Peripheral blood analysis of mice 2 days after T-cell injection. P value was obtained by 1-way ANOVA analysis. Panels A to C are representative of 2 experiments with 3 to 4 mice per group. Bar graphs and data points represent mean ± SE. (D) Comparison of leukemia bioluminescent signal and peripheral blood donor T-cell percentage of CD8 2 days after T-cell injection. Data points are individual mice from 2 experiments. In 1 of 2 experiments Leu16+ T cells were titrated into WT mice at 0.1, 0.3, and 107 T cells/mouse.
Figure 3
Figure 3
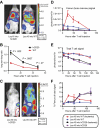
Expression of CD20 on normal B cells alters the trafficking and survival of CD20-specific cTCR+ T cells. (A) Bioluminescent imaging of 107 CBR+Leu16+Thy1.1+CD8+ T cells 4 hours after intravenous injection into WT or hCD20 mice. (B) The lung-to-nonlung bioluminescent ratio was calculated for mice injected with 107 CBR+Leu16+Thy1.1+CD8+ T cells after various time intervals. Data from 2 experiments were overlaid, comprising 7 to 10 mice per time point. Red outlines in panels A and C are representative of regions of interest for signal quantitation. (C) Bioluminescent image of mice 48 hours after T-cell injection. (E) Serial quantitation of T-cell bioluminescent signal from the femurs in panel D, and the entire mouse in panel E was performed over time. (F) The relative T-cell signal originating from the femurs was calculated by division of total signals from femurs by total signals from mice. The data are representative of 2 experiments with 3 to 5 mice per group each. Data points represent mean ± SE. P values were obtained by 2-tailed t tests. Bioluminescent images were assembled with the use of Illustrator (Adobe Systems).
Figure 4
Figure 4
Antigen-specific retention of CD20-specific cTCR+ T cells depends on CD3ζ signaling and LFA-1. (A) Murine CD8+ T cells expressing the MB20-18+ cTCR exhibit antigen-specific cytolytic activity toward mCD20 expressing cell lines (A20, EL4-CD20), but not control cells (EL4-hCD20, BM185). Standard 5-hour 51Cr release assay analysis of MB20-18+cTCR+CD8+ T-cell lytic activity. Data are representative of 2 experiments. (B) Calculation of lung to non-lung bioluminescent signal ratio from mice injected intravenously with 107 CBR+cTCR+Thy1.1+CD8+ T cells. Data from 2 experiments were overlaid comprising 7 to 8 mice per time point. (C) Lytic activity of cTCR or cTCR+ T cells toward WT B cells and BM185-mCD20. T cells were incubated with targets for 3 hours, and target lysis was determined by a 7AAD assay as described in “In vitro T-cell analysis.” Data are representative of 2 experiments. (D) cTCR or cTCR+ T cells were conjugated with freshly isolated WT B cells, and the percentage of T cells in conjugates was determined by flow cytometry as described in “In vitro T-cell analysis.” Data are representative of 3 experiments. (E) Bioluminescent image of mice 24 hours after receiving 107 CBR+MB20-18+CD8+ T cells that had been treated with anti–LFA-1 or PBS before injection. (F) Serial quantitation of T-cell bioluminescent signal from mice injected with CBR+cTCR+Thy1.1+CD8+ T cells. Data are representative of 2 experiments with 3 to 4 mice per group. Bar graphs and data points represent mean ± SE. Bioluminescent images were assembled with the use of Illustrator (Adobe Systems).
Figure 5
Figure 5
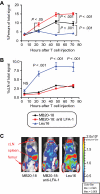
Anti–LFA-1 enhances accumulation of CD20-specific T cells in the BM but not LNs. (A-B) A total of 107 CBR+Thy1.1+cTCR+CD8+ T cells pretreated with either anti–LFA-1 or PBS were injected intravenously into WT mice. Serial bioluminescent imaging of T cells was performed, and the relative signals emitted were calculated by dividing the signal from the femurs in panel A or cervical LN (cLN) in panel B by the total bioluminescent signal. Data points represent the mean ± SE. Figures contain data from 2 experiments with 7 to 8 mice per group total. P values were obtained by 1-way ANOVAs, followed by a Bonferroni selected comparison test. (C) Depiction of cervical LN and femur gates from representative mice.
Figure 6
Figure 6
B-cell depletion with anti-hCD20 antibodies promotes CD20-specific cTCR+ T-cell survival and function. (A) Calculation of lung-to-nonlung bioluminescent signal ratio from mice injected intravenously with 2 × 10⁷ CBR+cTCR+Thy1.1+CD8+ T cells. Data from 2 experiments were overlaid, comprising 7 to 8 mice per time point. (B) Serial quantitation of T-cell bioluminescent signal from mice injected with cTCR+ T cells. Data are representative of 2 experiments with 3 to 4 mice per group. Data points represent mean ± SE. (C) Bioluminescent image of mice from panel B 72 hours after injection. (D-F) Five days after CBR+cTCR+Thy1.1+CD8+ T cells were injected into untreated or B cell–depleted mice, spleens were harvested, and the remaining CD19+ B cells were enumerated. (D) 1F5 (200 μg) was injected into hCD20 mice 4 days before T-cell injection. Horizontal lines represent the mean of the data. (E) Quantitation of MZ and follicular (FO) B cells. Bar graphs represent mean ± SE. Combined data from 2 experiments with 3 to 4 mice per group are shown (D-E). Bar graphs and data points represent mean ± SE. (F) Magnification of panel E. P values were obtained by 1-way ANOVA with a Tukey post hoc test. Bioluminescent images were assembled with the use of Illustrator (Adobe Systems).
Figure 7
Figure 7
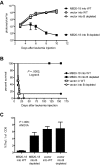
B-cell depletion enhances the antileukemic function of CD20-specific cTCR+ T cells. (A) WT or B cell–depleted mice received 2 × 10⁷ BM185-mCD20/Thy1.1-ffLuc-Neo intravenously and were treated 3 days later with 107 MB20-18 or vector-transduced Thy1.1+CD8+ T cells. 1F5 (200 μg) was injected 4 days before T-cell injection. Serial quantitation of leukemia bioluminescent signal was performed after T-cell injection. Data are representative of 2 experiments with 4 mice per group. (B) Survival of mice after treatment. Cumulative data from 2 separate experiments with 8 mice per group total are depicted. The first experiment was censored at 154 days and the second at 118 days, when data analysis was performed. P value was obtained with the log-rank test. (C) Peripheral blood analysis of mice 3 days after T-cell injection. P value was obtained by 1-way ANOVA analysis. Data are representative of 2 experiments with 4 mice per group. Data points and bar graphs represent mean ± SE.

References

    1. Wang J, Jensen M, Lin Y, et al. Optimizing adoptive polyclonal T cell immunotherapy of lymphomas, using a chimeric T cell receptor possessing CD28 and CD137 costimulatory domains. Hum Gene Ther. 2007;18(8):712–725. - PubMed
    1. Wang J, Press OW, Lindgren CG, et al. Cellular immunotherapy for follicular lymphoma using genetically modified CD20-specific CD8+ cytotoxic T lymphocytes. Mol Ther. 2004;9(4):577–586. - PubMed
    1. Jensen MC, Clarke P, Tan G, et al. Human T lymphocyte genetic modification with naked DNA. Mol Ther. 2000;1(1):49–55. - PubMed
    1. Till BG, Jensen MC, Wang J, et al. Adoptive immunotherapy for indolent non-Hodgkin lymphoma and mantle cell lymphoma using genetically modified autologous CD20-specific T cells. Blood. 2008;112(6):2261–2271. - PMC - PubMed
    1. James SE, Greenberg PD, Jensen MC, et al. Antigen sensitivity of CD22-specific chimeric TCR is modulated by target epitope distance from the cell membrane. J Immunol. 2008;180(10):7028–7038. - PMC - PubMed

Publication types

MeSH terms