Clinical Trial
. 2010 Feb 18;115(7):1394-405.
doi: 10.1182/blood-2009-05-218560. Epub 2009 Oct 30.

Gene expression classifiers for relapse-free survival and minimal residual disease improve risk classification and outcome prediction in pediatric B-precursor acute lymphoblastic leukemia

Affiliations
Clinical Trial

Gene expression classifiers for relapse-free survival and minimal residual disease improve risk classification and outcome prediction in pediatric B-precursor acute lymphoblastic leukemia

Huining Kang et al. Blood. .

Abstract

To determine whether gene expression profiling could improve outcome prediction in children with acute lymphoblastic leukemia (ALL) at high risk for relapse, we profiled pretreatment leukemic cells in 207 uniformly treated children with high-risk B-precursor ALL. A 38-gene expression classifier predictive of relapse-free survival (RFS) could distinguish 2 groups with differing relapse risks: low (4-year RFS, 81%, n = 109) versus high (4-year RFS, 50%, n = 98; P < .001). In multivariate analysis, the gene expression classifier (P = .001) and flow cytometric measures of minimal residual disease (MRD; P = .001) each provided independent prognostic information. Together, they could be used to classify children with high-risk ALL into low- (87% RFS), intermediate- (62% RFS), or high- (29% RFS) risk groups (P < .001). A 21-gene expression classifier predictive of end-induction MRD effectively substituted for flow MRD, yielding a combined classifier that could distinguish these 3 risk groups at diagnosis (P < .001). These classifiers were further validated on an independent high-risk ALL cohort (P = .006) and retainedindependent prognostic significance (P < .001) in the presence of other recently described poor prognostic factors (IKAROS/IKZF1 deletions, JAK mutations, and kinase expression signatures). Thus, gene expression classifiers improve ALL risk classification and allow prospective identification of children who respond or fail current treatment regimens. These trials were registered at http://clinicaltrials.gov under NCT00005603.


Figures

Figure 1
Figure 1
Performance of the 42-probe-set (38-gene) gene expression classifier for prediction of RFS. (A-B) Kaplan-Meier survival estimates of RFS in the full cohort of 207 patients (A) and in the low- versus high-risk groups distinguished with the gene expression classifier for RFS (B). HR is the hazard ratio estimated using Cox regression. (C) A gene expression heatmap is shown with the rows representing the 42 probe sets (containing 38 unique genes) composing the gene expression classifier for RFS. The columns represent patient samples sorted from left to right by time to relapse or last follow-up. Red indicates high expression relative to the mean; green, low expression relative to the mean; R, relapse; and C, continuous remission.
Figure 2
Figure 2
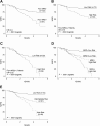
Kaplan-Meier estimates of RFS based on the gene expression classifier for RFS and end-induction (day 29) MRD. (A) Day 29 flow cytometric measures of MRD separated patients into 2 groups with significantly different RFS. (B-C) After dividing patients by their end-induction flow MRD status, an independent effect of the gene expression classifier for RFS is observed among both the flow MRD-negative (< 0.01% blasts; B) and flow MRD-positive (> 0.01% blasts; C) patients. (D-E) Combining the risk scores determined from the gene expression classifier and flow MRD yields 4 distinct outcome groups; the 2 discordant groups show no significant difference in RFS (P = .572) and are therefore collapsed into an intermediate-risk group for RFS prediction (E). (E) The hazard ratios (HR) and corresponding P values are based on the Cox regression (medium-risk vs low-risk, HR = 3.73, P = .001; high-risk vs medium-risk, HR = 2.27, P = .002). The P value reported in the lower left corner corresponds to the test for differences among all groups.
Figure 3
Figure 3
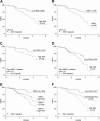
Kaplan-Meier estimates of RFS based on the gene expression classifier for RFS modeled on high-risk ALL cases lacking known recurring cytogenetic abnormalities and end-induction (day 29) MRD. (A) The second gene expression classifier modeled only on those high-risk ALL cases (n = 163; supplemental Table 8) from the COG 9906 ALL cohort lacking recurring cytogenetic abnormalities resolves 2 distinct risk groups of patients with significantly different RFS. (B) Day 29 flow MRD status separated these 163 ALL cases into 2 groups with significantly different RFS. (C-D) After dividing patients by their end-induction flow MRD status, an independent effect of the gene expression classifier for RFS is observed among both the flow MRD-negative (< 0.01% blasts; C) and flow MRD-positive (> 0.01% blasts; D) patients. (E-F) Combining the risk scores determined from the gene expression classifier and flow MRD yields 4 distinct outcome groups (E); the 2 discordant groups show no significant difference in RFS and are therefore collapsed into an intermediate-risk group for RFS prediction (F). (F) The hazard ratios (HR) and corresponding P values are based on the Cox regression (high-risk vs intermediate-risk, HR = 2.26, P = .007; intermediate-risk vs low-risk, HR = 2.77, P = .008). The P value reported in the lower left corner corresponds to the test for differences among all groups.
Figure 4
Figure 4
Gene expression classifier for prediction of end-induction (day 29) flow MRD in pretreatment samples combined with the gene expression classifier for RFS. (A) A ROC shows the high accuracy of the 23-probe-set MRD classifier (LOOCV error rate of 24.61%; sensitivity 71.64%, specificity 77.42%) in predicting MRD. The area under the ROC curve (0.80) is significantly greater than an uninformative ROC curve (0.5; P < .001). (B) Heatmap of 23-probe-set predictor of MRD presented in rows (false discovery rate < .001%, SAM). The columns represent patient samples with positive or negative end-induction flow MRD, whereas the rows are the specific predictor genes. Red: high expression relative to the mean; green: low expression relative to the mean. (C) Kaplan-Meier estimates of RFS for the risk groups determined by combining the gene expression classifiers for RFS and MRD, analogous to Figure 2E, with the gene expression predictor for MRD replacing day 29 flow MRD. The 3 risk groups have significantly different RFS (log rank test, P < .001).
Figure 5
Figure 5
Kaplan-Meier estimates of RFS using the combined gene expression classifiers for RFS and MRD in an independent cohort of 84 children with high-risk ALL. (A) The gene expression classifier for RFS separates children into low- and high-risk groups in an independent cohort of 84 children with high-risk ALL treated on COG Trial 1961., (B) Application of the combined gene expression classifiers for RFS and MRD shows significant separation of 3 risk groups: low (47 of 84, 56%), intermediate (22 of 84, 26%), and high (15 of 84, 18%), similar to our initial cohort (Figure 3C).
Figure 6
Figure 6
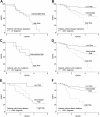
Kaplan-Meier estimates of RFS using the combined gene expression classifier for RFS and flow cytometric measures of MRD in the presence of kinase signatures, JAK mutations, and IKAROS/IKZF1 deletions. (A-B) Application of the original 42-probe-set (38-gene; supplemental Table 4) gene expression classifier for RFS combined with end-induction flow cytometric measures of MRD distinguishes 2 distinct risk groups in COG 9906 ALL patients with kinase signatures (A) and 3 risk groups in those patients lacking kinase signatures (B). (C-D) Application of the combined classifier also resolves 2 distinct and statistically significant risk groups in ALL patients with JAK mutations (C) and in 3 risk groups in those patients lacking JAK mutations (D). (E-F) Application of the combined classifier distinguishes 3 risk groups with statistically significant RFS and patients with (E) and without IKAROS/IKZF1 deletions. The P value reported in the lower left corner corresponds to the log rank test for differences among all groups.

Comment in

Similar articles

Cited by

References

    1. Pui CH, Evans WE. Drug therapy: treatment of acute lymphoblastic leukemia. N Engl J Med. 2006;354:166–178. - PubMed
    1. Pui CH, Robison LL, Look AT. Acute lymphoblastic leukemia. Lancet. 2008;371:1030–1043. - PubMed
    1. Pui CH, Pei DQ, Sandlund JT, et al. Risk of adverse events after completion of therapy for childhood acute lymphoblastic leukemia. J Clin Oncol. 2005;23:7936–7941. - PubMed
    1. Schultz KR, Pullen DJ, Sather HN, et al. Risk- and response-based classification of childhood B-precursor acute lymphoblastic leukemia: a combined analysis of prognostic markers from the Pediatric Oncology Group (POG) and Children's Cancer Group (CCG). Blood. 2007;109:926–935. - PMC - PubMed
    1. Smith M, Arthur D, Camitta B, et al. Uniform approach to risk classification and treatment assignment for children with acute lymphoblastic leukemia. J Clin Oncol. 1996;14:18–24. - PubMed

Publication types

MeSH terms

Associated data