. 2009 Dec 25;284(52):36511-36520.
doi: 10.1074/jbc.M109.073072. Epub 2009 Oct 30.

RNA interference in Trypanosoma brucei: role of the n-terminal RGG domain and the polyribosome association of argonaute

Affiliations

RNA interference in Trypanosoma brucei: role of the n-terminal RGG domain and the polyribosome association of argonaute

Huafang Shi et al. J Biol Chem. .

Abstract

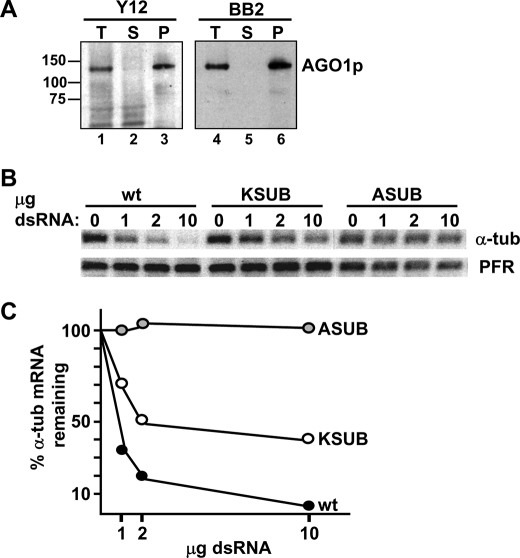
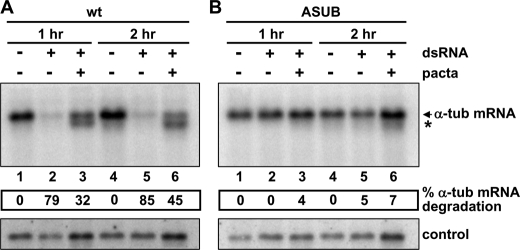
Argonaute proteins (AGOs) are central to RNA interference (RNAi) and related silencing pathways. At the core of the RNAi pathway in the ancient parasitic eukaryote Trypanosoma brucei is a single Argonaute protein, TbAGO1, with an established role in the destruction of potentially harmful retroposon transcripts. One notable feature of TbAGO1 is that a fraction sediments with polyribosomes, and this association is facilitated by an arginine/glycine-rich domain (RGG domain) at the N terminus of the protein. Here we report that reducing the size of the RGG domain and, in particular, mutating all arginine residues severely reduced the association of TbAGO1 with polyribosomes and RNAi-induced cleavage of mRNA. However, these mutations did not change the cellular localization of Argonaute and did not affect the accumulation of single-stranded siRNAs, an essential step in the activation of the RNA-induced silencing complex. We further show that mRNA on polyribosomes can be targeted for degradation, although this alliance is not a pre-requisite. Finally, sequestering tubulin mRNAs from translation with antisense morpholino oligonucleotides reduced the RNAi response indicating that mRNAs not engaged in translation may be less accessible to the RNAi machinery. We conclude that the association of the RNAi machinery and target mRNA on polyribosomes promotes an efficient RNAi response. This mechanism may represent an ancient adaptation to ensure that retroposon transcripts are efficiently destroyed, if they become associated with the translational apparatus.


Figures

FIGURE 1.
FIGURE 1.
Mutations in the RGG domain affect the RNAi response. Schematic diagram of T. brucei AGO1 and mutant derivatives. The first 70 amino acids, including the RGG domain, are shown enlarged with the RGG repeats indicated by gray boxes. Dots indicate deleted amino acids. The amino acid sequence of the RGG domain and mutant derivatives is displayed in supplemental Fig. 1. The drawing is not to scale. Right column (% FAT cells) indicates the % of cells that acquired the FAT phenotype (see text for details) 16 h after transfection with dsRNA homologous to the 5′ UTR of α-tubulin mRNA. Each mutant cell line was challenged with non-saturating amounts of dsRNA (0.5 or 1.0 μg of dsRNA per transfection), and the percentage of FAT cells was normalized to the response of cells expressing wt TbAGO1, which was set at 100%. The value of <5% FAT cells indicates that the RNAi response was severely inhibited; this is the minimal value at or above which the FAT cell phenotype is informative.
FIGURE 2.
FIGURE 2.
A, TbAGO1 is recognized by the Y12 monoclonal antibody. Western blot analysis of a total cytoplasmic extract (T, lanes 1 and 4), supernatant (S, lanes 2 and 5), and immunoprecipitated AGO1 (P, lanes 3 and 6) with Y12 or anti-BB2 antibodies. Molecular masses are indicated in kilodaltons. B, substitution of arginine residues in the TbAGO1 RGG domain inhibits degradation of α-tubulin mRNA in response to transfection of homologous dsRNA. Wild-type, KSUB, and ASUB cells were electroporated with different amounts (in micrograms) of α-tubulin dsRNA, as indicated above each lane or with poly(I-C) (lane 0), and total RNA was prepared 2 h after electroporation. The level of α-tubulin mRNA was monitored by Northern blotting with a radiolabeled DNA probe derived from the tubulin coding region. The bottom panel shows the hybridization to the paraflagellar rod (PFR) protein mRNA that served as a loading control. C, quantitation of α-tubulin mRNA degradation. For each cell line α-tubulin mRNA hybridization was quantitated by PhosphorImager analysis and was plotted as the fraction of mRNA remaining 2 h after electroporation, setting as 100% the amount of α-tubulin mRNA present in the samples that received poly(I-C). A representative experiment is shown.
FIGURE 3.
FIGURE 3.
Cell fractionation of cells expressing wild-type AGO1 (A), KSUB (B), and ASUB (C) mutant proteins. Total cell lysates (lane 1) were fractionated into cytosolic proteins (lane 2) and a pellet (lane 3). Membrane proteins were extracted from the pellet (lane 4), and the insoluble material (lane 5) was further fractionated into nuclear proteins (lane 6) and cytoskeletal proteins (lane 7). Panels were reacted with an antibody to TbAGO1, Hsp83, BiP, and TbISWI. TbISWI is indicated by an arrow, just above a cross-reacting band (34).
FIGURE 4.
FIGURE 4.
A, fractionation of wild-type AGO1 and RGG-domain mutant derivatives between soluble and ribosome-enriched material. Extracts were prepared as described (18), and the soluble material after centrifugation at 14,000 × g for 10 min (S14) was further fractionated by centrifugation at 100,000 × g for 1 h. A 30% sucrose cushion was layered at the bottom of the tubes to minimize contamination of the ribosome-enriched pellet (P100) fraction by the soluble material (S100). Equivalent amounts of S14, S100, and P100 fractions were separated by SDS-PAGE and Western blotted with anti-AGO1 polyclonal antibodies (AGO1 panels) or T. cruzi anti-P0 polyclonal antibodies (PO panels), which monitor the sedimentation of the 60 S ribosomal subunit. B, sucrose density gradients of cytoplasmic extracts from cells expressing wild-type (wt), KSUB, and ASUB AGO1. The sucrose density gradient fractions were analyzed by Western blots using a rabbit anti-AGO1 polyclonal antibody (wt, KSUB, and ASUB panels) or T. cruzi anti-P0 polyclonal antibodies (PO panels) to monitor the sedimentation of the 60 S ribosomal subunit.
FIGURE 5.
FIGURE 5.
siRNA analysis in cells expressing mutant AGO1 proteins. A, small RNAs isolated from each cell line as indicated was analyzed by Northern blot hybridization with an Ingi radiolabeled probe. Hybridization to tRNAMet served as a loading control (con). B, association of wild-type (wt), ASUB, and KSUB AGO1 with Ingi siRNAs. A cytoplasmic extract from cells expressing N-terminal BB2-tagged AGO1 proteins was subjected to immunoprecipitation with anti-BB2 antibodies, and supernatant (S) and pellet (P) fractions were processed for Western blot analysis for AGO1 (upper panel), Northern blot analysis for Ingi siRNAs (middle panel), and tRNAMet (bottom panel), which served as a control for immunoprecipitation specificity. C, siRNAs in cells expressing wild-type (wt), R735, ΔRGG, ASUB, and KSUB AGO1 are single-stranded. RNA from an S100 extract without (−) or with incubation at 95 °C (+) prior to electrophoresis was electrophoresed on a 15% native polyacrylamide gel and hybridized to an oligonucleotide probe complementary to the most abundant Ingi siRNA. A synthetic 32P-labeled siRNA duplex (con) served as a marker for migration of single-stranded (ss) and double-stranded (ds) siRNAs.
FIGURE 6.
FIGURE 6.
dsRNA-triggered degradation of α-tubulin mRNA can occur in the presence of cycloheximide. A, schematic representation of the coding region of α-tubulin mRNA; the approximate position of the 114-dsRNA is indicated by the solid box and the position of the 5′ and 3′ probes used for Northern analysis is indicated by the stippled boxes. The drawing is not to scale. B, Northern blot analysis of α-tubulin mRNA levels with the 5′ or 3′ probe 1 h after transfection with 20 μg of 114-dsRNA (+ lanes) or with 20 μg poly(I-C) (− lane) in the presence or absence of cycloheximide as indicated above each lane (see text for details). C, sucrose density gradient analysis of the distribution of intact and cleavage fragments of α-tubulin mRNA in cytoplasmic extracts from cells transfected with 114-dsRNA in the presence of cycloheximide. The bottom panel shows the methylene blue staining of the large ribosomal RNAs in the sucrose density gradient fractions. The positions of the 40 S subunit and the 80 S monosome are indicated.
FIGURE 7.
FIGURE 7.
A, schematic representation of α-tubulin mRNA showing the position of the 5′ UTR dsRNA trigger (solid box) and the sequences corresponding to the 5′ tubulin probe (stippled box). B, RNAi of α-tubulin mRNA can proceed in the presence of pactamycin. Northern blot hybridization of RNA isolated from cells electroporated with dsRNA homologous to the α-tubulin 5′ UTR. Cells were preincubated with no drug (no drug) or with 200 μg/ml pactamycin (pactamycin) for 15 min and then 10 μg of poly(IC) (− lanes) or 10 μg of 5′ UTR dsRNA (+ lanes) was electroporated. Incubation was continued in medium with or without the drug for 1 or 2 h, as indicated above each lane. 10 μg of total RNA was electrophoresed through a 1.5% agarose-formaldehyde gel and then analyzed by Northern blot hybridization with a tubulin probe, corresponding to nucleotides 1–300 of the α-tubulin coding region. A smaller α-tubulin RNA species, indicated by an asterisk, represents the 3′ cleavage product. Each membrane shown in B was stripped and rehybridized with a probe detecting the procyclin mRNA as a loading control (control). A similar result was obtained using the 114-dsRNA trigger.
FIGURE 8.
FIGURE 8.
RNAi of α-tubulin mRNA in the presence of pactamycin. A, Northern blot hybridization of RNA isolated from wild-type cells electroporated with dsRNA homologous to the α-tubulin 5′ UTR essentially as described in Fig. 7. B, Northern blot hybridization of RNA isolated from cells expressing ASUB AGO1 and exposed to dsRNA and pactamycin (pacta) as indicated. A smaller α-tubulin RNA species, indicated by an asterisk, represents the 3′ cleavage product. Each membrane shown was stripped and rehybridized with a probe detecting the procyclin mRNA as a loading control (control).
FIGURE 9.
FIGURE 9.
A, morpholino antisense oligonucleotides sequester α- or β-tubulin mRNA from translation. 108 trypanosomes were electroporated with 10 nmol of morpholino oligonucleotide αtub1 (complementary to positions −20 to +5 of α-tubulin mRNA with respect to the AUG initiation codon), βtub1 (complementary to positions −20 to +5 of β-tubulin mRNA with respect to the AUG initiation codon), or control (an oligonucleotide of unrelated sequence) or with α- or β-tubulin dsRNA (114-dsRNA for α-tubulin and BT2-dsRNA for β-tubulin, corresponding to positions 350–690 of the β-tubulin coding region). 1 or 2 h after transfection the cells were pulse-labeled for 15 min with [35S]methionine, and following lysis with SDS-loading buffer the radiolabeled proteins were separated by PAGE as described (54). The position of α- and β-tubulin is indicated and supported by the disappearance of the corresponding band upon transfection with homologous dsRNA (lanes 5 and 8). The autoradiogram of the dried gel is shown. B and C, co-transfection of morpholino antisense oligonucleotides with homologous dsRNA dampens the RNAi response. The identity of the morpholino oligonucleotides and the dsRNA is indicated above each lane and at the bottom of each panel, respectively. RNA was extracted 1 or 2 h after transfection and analyzed by Northern blot hybridization with the α-tubulin 5′ tubulin probe (see Fig. 6) and a β-tubulin probe corresponding to positions 1050–1340 of β-tubulin mRNA. Each of the membranes shown in B and C was stripped and rehybridized with a procyclin probe as a loading control (con).

Similar articles

Cited by

References

    1. Farazi T. A., Juranek S. A., Tuschl T. (2008) Development 135, 1201–1214 - PubMed
    1. Cerutti H., Casas-Mollano J. A. (2006) Curr. Genet. 50, 81–99 - PMC - PubMed
    1. Tolia N. H., Joshua-Tor L. (2007) Nat. Chem. Biol. 3, 36–43 - PubMed
    1. Hutvagner G., Simard M. J. (2008) Nat. Rev. Mol. Cell Biol. 9, 22–32 - PubMed
    1. Hammond S. M., Boettcher S., Caudy A. A., Kobayashi R., Hannon G. J. (2001) Science 293, 1146–1150 - PubMed

Publication types

MeSH terms

LinkOut - more resources