. 2010 Feb;113(2):453-67.
doi: 10.1093/toxsci/kfp268. Epub 2009 Oct 30.

Airway trefoil factor expression during naphthalene injury and repair

Affiliations

Airway trefoil factor expression during naphthalene injury and repair

Melanie A Greeley et al. Toxicol Sci. 2010 Feb.

Abstract

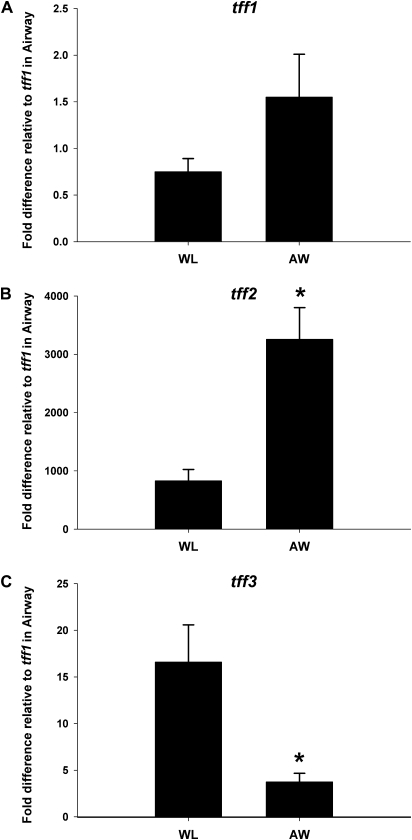
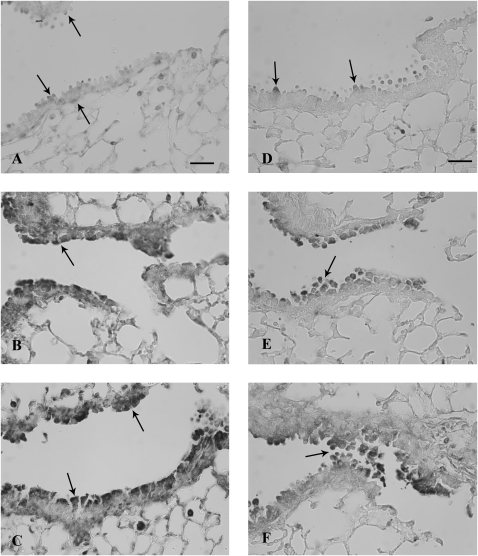
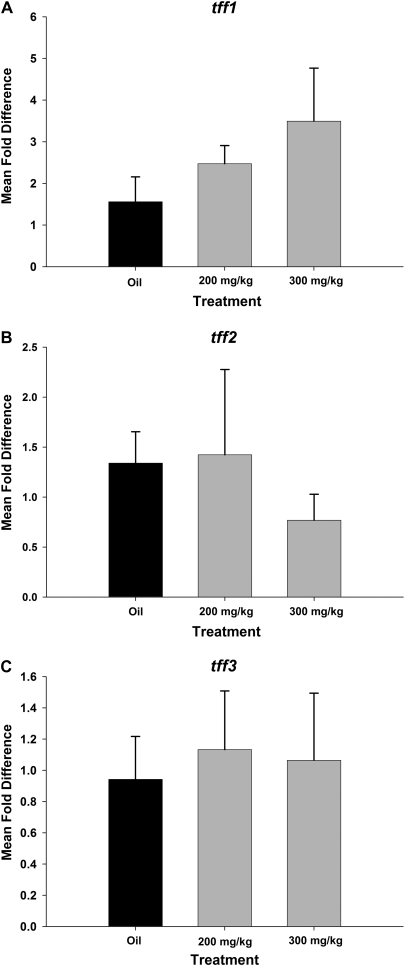
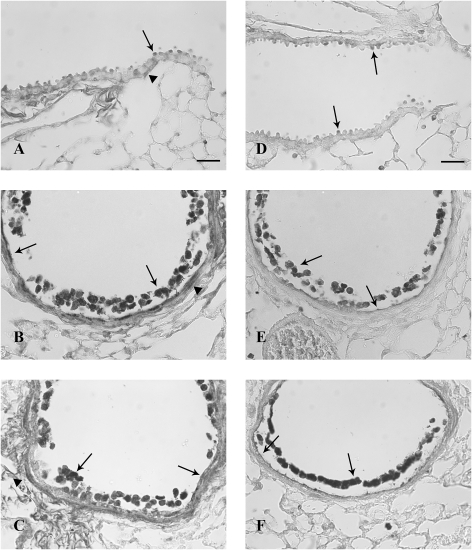
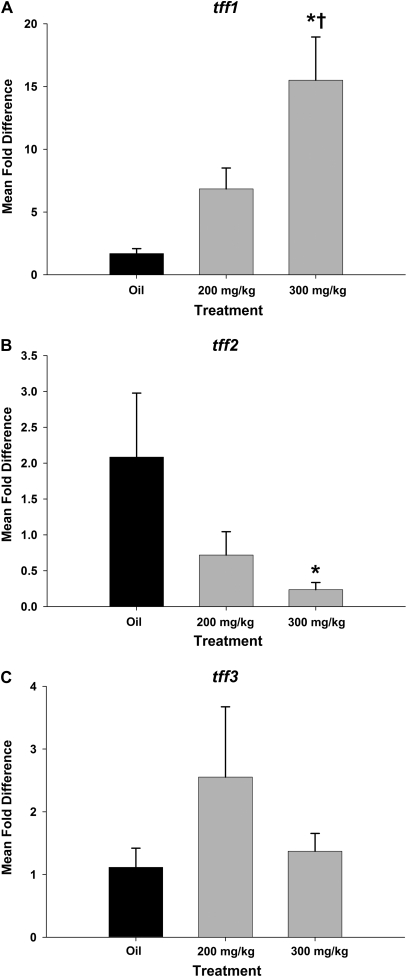
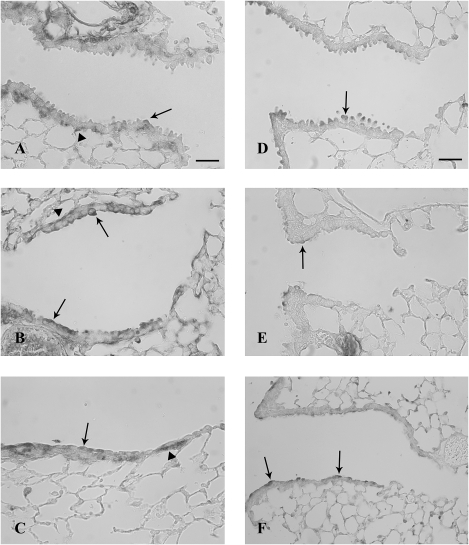
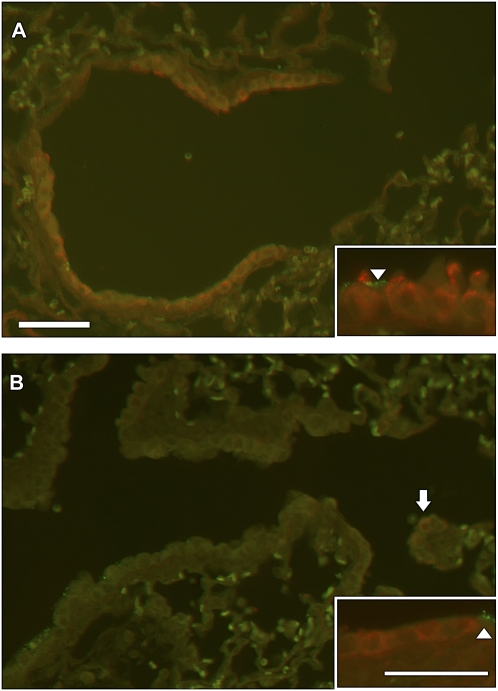
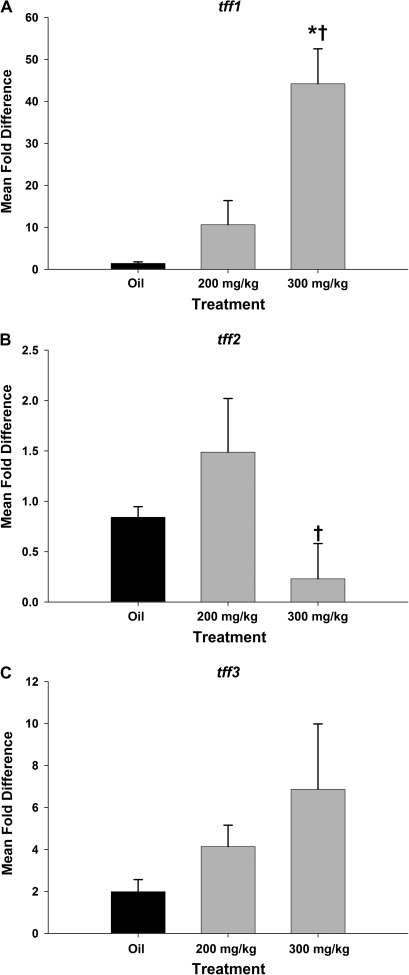
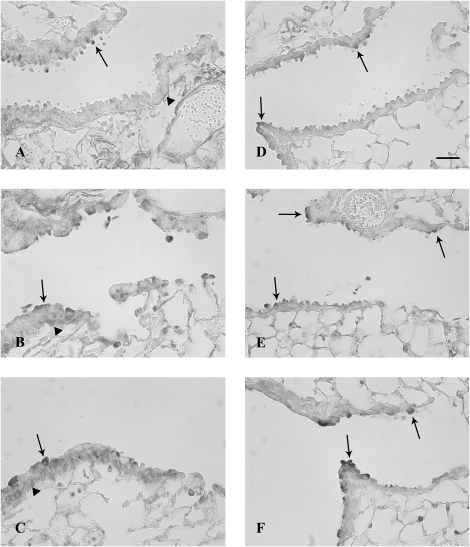
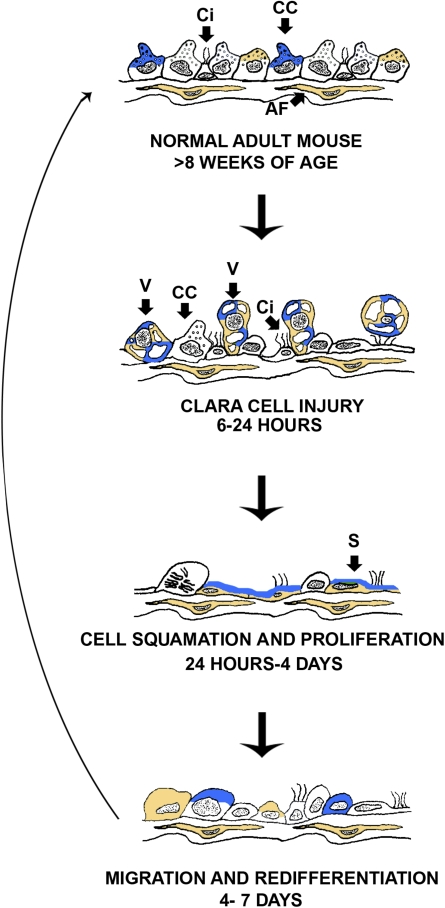
While the role of trefoil factors (TFF) in the maintenance of epithelial integrity in the gastrointestinal tract is well known, their involvement in wound healing in the conducting airway is less well understood. We defined the pattern of expression of TFF1, TFF2, and TFF3 in the airways of mice during repair of both severe (300 mg/kg) and moderate (200 mg/kg) naphthalene-induced Clara cell injury. Quantitative real-time PCR for tff messenger RNA expression and immunohistochemistry for protein expression were applied to airway samples obtained by microdissection of airway trees or to fixed lung tissue from mice at 6 and 24 h and 4 and 7 days after exposure to either naphthalene or an oil (vehicle) control. All three TFF were expressed in normal whole lung and airways. TFF2 was the most abundant and was enriched in airways. Injury of the airway epithelium by 300 mg/kg naphthalene caused a significant induction of tff1 gene expression at 24 h, 4 days, and 7 days. In contrast, tff2 was decreased in the high-dose group at 24 h and 4 days but returned to baseline levels by 7 days. tff3 gene expression was not significantly changed at any time point. Protein localization via immunohistochemistry did not directly correlate with the gene expression measurements. TFF1 and TFF2 expression was most intense in the degenerating Clara cells in the injury target zone at 6 and 24 h. Following the acute injury phase, TFF1 and TFF2 were localized to the luminal apices of repairing epithelial cells and to the adjacent mesenchyme in focal regions that correlated with bifurcations and the bronchoalveolar duct junction. The temporal pattern of increases in TFF1, TFF2, and TFF3 indicate a role in cell death as well as proliferation, migration, and differentiation phases of airway epithelial repair.


Figures

FIG. 1.
FIG. 1.
Comparison of gene expression for all three tff in airways (AW) versus whole lung (WL) from 24-h oil control mice. (A) tff1 was not differentially expressed in airways compared to whole lung. (B) tff2 was enriched in the airway-specific homogenate threefold. (C) In contrast, tff3 was significantly less abundant in the conducting airways than in a whole-lung homogenate. Results were calculated using the ΔΔCt method. GAPD was the reference gene. For ease of comparison of the different tff with each other, all data are expressed as fold difference from tff1 in the airways. Means and SEs indicate data obtained from eight different animals per end point. *Significantly different from whole lung at p < 0.05.
FIG. 2.
FIG. 2.
TFF protein expression in airways 6 h after systemic naphthalene exposure. Immunohistochemical detection (black staining) of TFF1 (A, B, and C) and TFF3 protein (D, E, and F) in terminal bronchioles. Oil controls (A and D) have light staining on the apex of Clara cells and in the peribronchiolar mesenchyme (arrows). Treatment with either 200 mg/kg naphthalene (B and E) or 300 mg/kg (C and F) increased epithelial staining (arrows) in degenerate Clara cells for both TFF1 and TFF2. TFF3 was also expressed in large round cells in alveoli, consistent with macrophages (C). Three mice were analyzed for each group at this time point (200 and 300 mg/kg naphthalene and time-matched oil control). Bar = 50 μm.
FIG. 3.
FIG. 3.
tff mRNA expression in airways 6 h after systemic naphthalene exposure. The fold change in tff mRNA expression was calculated by normalizing the raw expression to GAPD (housekeeping gene) and standardizing it to the oil controls. Expression of (A) tff1, (B) tff2, and (C) tff3 was not significantly different from the vehicle (oil) control at 6 h after naphthalene injury at either dose (200 or 300 mg/kg). Results were calculated using the ΔΔCt method. GAPD was the reference gene. Each tff factor is compared to its respective time-matched corn oil control. Means and SEs are from data obtained from a minimum of seven different animals per treatment group.
FIG. 4.
FIG. 4.
TFF protein expression in airways 24 h after systemic naphthalene exposure. Immunohistochemical detection (black staining) of TFF1 (A, B, and C) and TFF3 protein (D, E, and F) in distal bronchioles. Oil controls (A and D) have less intense protein expression than the naphthalene exposed (B, C, E, and F). There does not appear to be a difference in level of expression for TFF1 in degenerate Clara cells in the airway lumen when the two doses (200 mg/kg; B) are compared (300 mg/kg; C). However, there is a dose-dependent difference in the intensity of staining for TFF3 with the 300 mg/kg dose having more intense expression (F) than the 200 mg/kg dose (E). Full arrows indicate expression in normal (A and D), dead, and sloughed Clara cells (B, C, E, and F) and newly squamated cells (B, C, E, and F), while arrowheads show TFF1 expression in the peribronchiolar mesenchyme (A–C). Three mice were analyzed for each group at this time point (200 and 300 mg/kg naphthalene and time-matched oil control). Bar = 50 μm.
FIG. 5.
FIG. 5.
tff mRNA expression in airways 24 h after systemic naphthalene exposure. tff Fold change in mRNA expression was calculated by normalizing the raw expression to GAPD (housekeeping gene) and standardizing it to the oil controls. tff1 expression (A) was significantly increased only in the 300 mg/kg naphthalene exposure group. In contrast, tff2 (B) expression is significantly decreased at 300 mg/kg. tff3 (C) did not change significantly. *Significantly different from the oil control group, p < 0.05. †Significantly different from 200 mg/kg naphthalene treated, p < 0.05. Results were calculated using the ΔΔCt method. GAPD was the reference gene. Each TFF factor is compared to its respective time-matched corn oil control. Means and SEs are from data obtained from a minimum of six different animals per treatment group.
FIG. 6.
FIG. 6.
TFF protein expression in airways 4 days after systemic naphthalene exposure. Immunohistochemical detection (black-gray staining) of TFF1 (A, B, and C) and TFF3 protein (D, E, and F) in terminal bronchioles. Oil controls (A and D) have similar staining to the naphthalene exposed (B, C, E, and F). TFF1 expression was localized to the apex of Clara cells (arrows) and peribronchiolar mesenchyme (arrowheads) in both the 200 mg/kg naphthalene (B) and the 300 mg/kg groups (C). TFF3 was focally expressed in the apex of low cuboidal epithelium most prominently in the 300 mg/kg exposure group (F) and at terminal bronchiole bifurcations in the 200 mg/kg (E) group. Three mice were analyzed for each of the three treatment groups at this time point (200 and 300 mg/kg naphthalene and time-matched oil control). Bar = 50 μm.
FIG. 7.
FIG. 7.
Cell differentiation in the terminal bronchiole at 4 days after injury from 200 mg/kg naphthalene. CCSP (red staining) for differentiated Clara cells and β-tubulin IV as a marker for cilia (green staining) in the mouse terminal bronchiole of an oil-treated control (A) and a naphthalene injured and repairing airway (B). The control airway contains abundant differentiated Clara cells with characteristic apical domes (inset in A) protruding into the airway and ciliated cells (arrowheads). Terminal bronchiole from the naphthalene-treated animal does not contain abundant CCSP or β-tubulin IV (B). Clara cells that are positive for CCSP (arrow) do not have the domed apical protrusions and are low cuboidal (inset in B). These were found at the terminal bronchiole alveolar duct junction (arrowhead) and in larger more proximal airways including bifurcations. A minimum of three mice were analyzed for each of the treatment groups. Bar = 50 μm.
FIG. 8.
FIG. 8.
tff mRNA expression in airways 4 days after systemic naphthalene exposure. tff fold change in mRNA expression was calculated by normalizing the raw expression to GAPD (housekeeping gene) and standardizing it to the oil controls. tff1 (A) gene expression significantly increased >40-fold in the group exposed to a single high dose of naphthalene (300 mg/kg) compared to both oil controls and the low-dose group. In contrast, tff2 gene expression (B) was significantly decreased when the high-dose group was compared to the low-dose group. tff3 expression (C) is not changed. *Significant from oil control. †Significantly different from 200 mg/kg naphthalene treated (p < 0.05). Results were calculated using the ΔΔCt method. GAPD was the reference gene. Each tff factor is compared to its respective time-matched corn oil control. Means and SEs are from data obtained from a minimum of six different animals per treatment group.
FIG. 9.
FIG. 9.
TFF protein expression in airways 7 days after systemic naphthalene exposure. Immunohistochemical detection (black staining) of TFF1 (A, B, and C) and TFF3 protein (D, E, and F) in terminal bronchioles. Oil controls (A and D) have lighter more diffuse staining than the naphthalene exposed (B, C, E, and F). TFF1-positive cuboidal Clara cells (full arrows) and peribronchiolar mesenchymal cells (arrowheads) were lightly stained but well distributed throughout the terminal bronchiole (B and C) in the naphthalene-exposed groups. TFF3-positive Clara cells (arrows) tended to be more intensely stained and to cluster at airway bifurcations and at the bronchoalveolar duct junction. This was more obvious in the 300 mg/kg naphthalene-treated group (F). Three mice were analyzed for each treatment group at this time point (200 and 300 mg/kg naphthalene and time-matched oil control). Bar = 50 μm.
FIG. 10.
FIG. 10.
tff mRNA expression in airways 7 days after systemic naphthalene exposure. tff fold change in mRNA expression was calculated by normalizing the raw expression to GAPD (housekeeping gene) and standardizing it to the oil controls. tff1 (A) gene expression remained significantly elevated >eightfold in the group exposed to a single high dose of naphthalene (300 mg/kg) compared to both oil controls and the low-dose group. While tff2 (B) gene expression was unchanged compared to oil controls for either treatment group. However, the high-dose naphthalene group (300 mg/kg) was significantly different from the low-dose group (200 mg/kg). tff3 expression was not significantly different from corn oil controls for either treatment group, although the low-dose group just missed significant at p = 0.06. foxj1, the ciliated cell regeneration marker was significantly elevated at this time point in both groups that had received naphthalene treatment. *Significant from oil control. †Significantly different from 200 mg/kg naphthalene treated (p < 0.05). Results were calculated using the ΔΔCt method. GAPD was the reference gene. Each gene is compared to its respective time-matched corn oil control. Means and SEs are from data obtained from a minimum of seven different animals per treatment group for A, B, and C. Means and SEs are from data obtained from three corn oil control animals and four naphthalene-treated animals in D.
FIG. 11.
FIG. 11.
Temporal expression of TFF1 and TFF3 in terminal bronchioles after systemic naphthalene. This is an illustration of the four time points and controls (steady state) examined. TFF1 is represented by the color gold and TFF3 by the color blue. Both TFF1 and TFF3 are expressed in the apical portion of Clara cells when the terminal bronchiole is in the steady state. At 6–24 h (Clara cell injury), swollen vacuolated Clara cells express both TFF1 and TFF3. At 24 h to 4 days (Ciliated cell squamation and cell proliferation), the dead Clara cells as well as the squamated cells express both TFF1 and TFF3. TFF1 is expressed throughout the squamated cell cytoplasm, while TFF3 is just in the apical portion. At 4–7 days (migration and redifferentiation), TFF1 and TFF3 primarily return to the apical portion of the cells with the occasional cell expressing them throughout the cytoplasm. At all time points, attenuated fibroblasts express tff1. CC, Clara cell; Ci, ciliated cell; AF, attenuated fibroblast.

Similar articles

Cited by

References

    1. Baker GL, Shultz MA, Fanucchi MV, Morin DM, Buckpitt AR, Plopper CG. Assessing gene expression in lung subcompartments utilizing in situ RNA preservation. Toxicol. Sci. 2004;77:135–141. - PubMed
    1. Bergstrom KS, Guttman JA, Rumi M, Ma C, Bouzari S, Khan MA, Gibson DL, Vogl AW, Vallance BA. Modulation of intestinal goblet cell function during infection by an attaching and effacing bacterial pathogen. Infect. Immun. 2008;76:796–811. - PMC - PubMed
    1. Bossenmeyer-Pourie C, Kannan R, Ribieras S, Wendling C, Stoll I, Thim L, Tomasetto C, Rio MC. The trefoil factor 1 participates in gastrointestinal cell differentiation by delaying G1-S phase transition and reducing apoptosis. J. Cell Biol. 2002;157:761–770. - PMC - PubMed
    1. Buckpitt A, Buonarati M, Avey LB, Chang AM, Morin D, Plopper CG. Relationship of cytochrome P450 activity to Clara cell cytotoxicity. II. Comparison of stereoselectivity of naphthalene epoxidation in lung and nasal mucosa of mouse, hamster, rat and rhesus monkey. J. Pharmacol. Exp. Ther. 1992;261:364–372. - PubMed
    1. Buckpitt A, Chang A, Weir A, Van Winkle L, Duan X, Philpot R, Plopper C. Relationship of cytochrome P450 activity to Clara cell cytotoxicity. IV. Metabolism of naphthalene and naphthalene oxide in microdissected airways from mice, rats and hamsters. Mol. Pharmacol. 1995;47:74–81. - PubMed

Publication types