Comparative Study
. 2009 Nov 17;106(46):19438-43.
doi: 10.1073/pnas.0903561106. Epub 2009 Oct 30.

Loss of parity between IL-2 and IL-21 in the NOD Idd3 locus

Affiliations
Comparative Study

Loss of parity between IL-2 and IL-21 in the NOD Idd3 locus

Helen M McGuire et al. Proc Natl Acad Sci U S A. .

Abstract

IL-2 and IL-21 are two cytokines with great potential to affect autoimmune infiltration of nonlymphoid tissue, and are contained within the strongest non-MHC-linked locus for type 1 diabetes (T1D) susceptibility on the nonobese diabetic (NOD) mouse (Idd3). IL-21 is necessary for the development of diabetes in the NOD mouse, but a number of important studies argue that decreased expression of IL-2 explains Idd3. In this study, we demonstrate that the amount of IL-21, but not IL-2, correlated with T1D incidence. During our analyses of the IL-2/IL-21 interval, we found that mice segregate into one of two distinct expression profiles. In the first group, which includes the C57BL/6 strain, both Il2 and Il21 were expressed at low levels. In the other group, which includes the NOD strain, Il2 and Il21 were both highly expressed. However, because NOD IL-2 mRNA was relatively unstable, IL-2 production was remarkably similar between strains. The increased production of IL-21 in NOD mice was found to result from two single nucleotide polymorphisms within the distal promoter region that conferred increased binding affinity for the transcription factor Sp1. Our findings indicate that a loss of locus parity after decreased IL-2 mRNA stability ensures that the high-expressing IL-21 allele persists in nature and provides a basis for autoimmunity.


Conflict of interest statement

The authors declare no conflict of interest.

Figures

Fig. 1.
Fig. 1.
CD4+ T cells from NOD mice have increased production of IL-21. (A) Sorted, activated CD4+ T cells stimulated with PMA and Ionomycin and IL-21 mRNA expression measured by real-time PCR at times shown. Values are presented as fold modulation (relative units) relative to unstimulated NODB6.Idd3 cells. Data are presented as mean ± SEM, n = 6–9 mice per group, three experiments. (B) Splenocytes from NOD, NOD.Idd3NOD/B6, and NODB6.Idd3 mice stimulated for 2 days with CD3 and CD28 mAb. IL-21 measured by ELISA and data presented as mean ± SEM, n = 6 mice per group, two experiments. (C) Cumulative incidence of diabetes in NOD, n = 15; NOD.Idd3NOD/B6, n = 18; and NODB6.Idd3 mice, n = 20. (D) Intronic IL-21 (premRNA) measured by allele specific pyrosequencing assay in CD3 and CD28 mAb stimulated splenocytes from NOD.Idd3NOD/B6 mice, n = 18–28 mice per group, three experiments. (E) Exonic IL-21 mRNA measured by pyrosequencing in CD3 and CD28 mAb stimulated NOD.Idd3NOD/B6 splenocytes. (F) Intronic and (G) exonic IL-21 mRNA expression measured in NOD, NOD.Idd3NOD/B6, and NODB6.Idd3 splenocytes stimulated with CD3 and CD28 mAb at times shown, n = 15 mice per group, four experiments. (H) Decay of exonic IL-21 mRNA from stimulated NOD, NOD.Idd3NOD/B6, and NODB6.Idd3 splenocytes treated with actinomycin D for the times indicated. Data shown as mean ± SEM where n = 6 per group, two experiments.
Fig. 2.
Fig. 2.
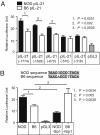
The NOD IL-21 promoter exhibits increased transcriptional activity. (A) IL-21 promoter activity measured in primary CD4+ T cells transfected with IL-21 promoter/luciferase reporter gene constructs, after 8-h stimulation with PMA and ionomycin. Data are presented as the mean ± SEM. (B) Site directed mutagenesis (SDM) was used to convert the Sp1 site in the NOD promoter (pIL-21 −1774) to the equivalent B6 site (NOD-Sp1) or create a NOD Sp1 site in the B6 promoter (B6+Sp1) in EL4 cells. Results are presented as the mean ± SEM, n = 3–4, for each luciferase assay.
Fig. 3.
Fig. 3.
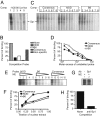
The NOD IL-21 promoter exhibits increased Sp1 binding. (A) Electromobility shift assay showing Sp1 binding complex on the IL-21 promoter. Stimulated EL4 nuclear extracts (NE) were incubated with 32P labeled probe specific for the NOD Sp1 binding site, in the absence of competitor (lane 1), or in competition with unlabeled NOD (lane 2), B6 (lane 3), consensus (Con) (lane 4), or nonspecific (Non) (lane 5) probes. (B) The level of inhibition for each Sp1 probe is shown relative to the total binding (100%). Data are representative of two experiments. (C) 32P labeled consensus Sp1 probe was titrated 1:2 (right to left) against 100-fold molar excess unlabeled consensus, NOD, or B6 probe. (D) Intensity of complexes relative to total binding (100%). Data are representative of two experiments. (E) EL4 NE was titrated over radio labeled probes derived from NOD, B6, or consensus sequence as indicated. (F) The intensity of complexes is shown relative to NOD Sp1 probe in the presence of excess EL4 NE. Data are representative of two experiments. (G) Binding of the NOD probe is lost when NE is incubated with Sp1 mAb (Ab) (lane 2). (H) Binding with Sp1 mAb is shown relative to total binding. Data are representative of two experiments.
Fig. 4.
Fig. 4.
Decreased stability of NOD mRNA. (A) Intronic IL-2 (premRNA) and (B) exonic IL-2 mRNA measured by allele specific pyrosequencing assay from NOD.Idd3NOD/B6 splenocytes stimulated with CD3 and CD28 mAb, n = 15 mice per group, four separate experiments. (C) Intronic and (D) exonic IL-2 mRNA expression measured by real-time PCR from NOD, NOD.Idd3NOD/B6, and NODB6.Idd3 splenocytes stimulated as above, n = 15 mice per group, four experiments. (E) Decay of exonic IL-2 mRNA from stimulated NOD, NOD.Idd3NOD/B6, and NODB6.Idd3 splenocytes treated with actinomycin D for the times indicated. Data shown are mean values ± SEM where n = 6 per group, from two experiments.
Fig. 5.
Fig. 5.
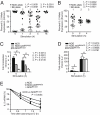
Equivalent amounts of IL-2 in NOD and NODB6.Idd3 mice. (A) Representative histograms showing CFSE dilution of transferred NOD.Idd3NOD/B6 (Idd3 F1) CD122+ CD44hi MP CD8+ T cells in NOD and NODB6.Idd3 hosts after daily i.p. injections of S4B6, PBS, or S4B6+rmIL-2 examined for the markers shown on day 7, (B) shown as percentage divided CD122+ CD44hi MP CD8+ T cells where n = 6, from two experiments. (C) Representative dot plots from flow cytometric analyses of IL-2 in NOD and NODB6.Idd3 CD4+ T cells directly ex vivo (unstimulated) and after 5-h stimulation of splenocytes and islet-extracted lymphocytes with PMA and Ionomycin. Mean fluorescence intensity (MFI) of IL-2 in CD4+ T cells (D) and CD8+ T cells (E) from the spleen and pancreas of NOD and NODB6.Idd3 mice, n = 8, from three experiments. (F) IL-2 detected by Western blot analysis in total lysates of CD44hi CD4+ and CD8+ T cells with band intensity quantified in arbitrary relative units, representative of three experiments.

References

    1. Denny P, et al. Mapping of the IDDM locus Idd3 to a 0.35-cM interval containing the interleukin-2 gene. Diabetes. 1997;46:695–700. - PubMed
    1. Todd JA, Wicker LS. Genetic protection from the inflammatory disease type 1 diabetes in humans and animal models. Immunity. 2001;15:387–395. - PubMed
    1. Todd JA, et al. Robust associations of four new chromosome regions from genome-wide analyses of type 1 diabetes. Nat Genet. 2007;39:857–864. - PMC - PubMed
    1. Zhernakova A, et al. Novel association in chromosome 4q27 region with rheumatoid arthritis and confirmation of type 1 diabetes point to a general risk locus for autoimmune diseases. Am J Hum Genet. 2007;81:1284–1288. - PMC - PubMed
    1. Allison J, et al. Genetic requirements for acceleration of diabetes in non-obese diabetic mice expressing interleukin-2 in islet beta-cells. Eur J Immunol. 1994;24:2535–2541. - PubMed

Publication types