. 2009 Oct;21(10):3245-56.
doi: 10.1105/tpc.108.064006. Epub 2009 Oct 30.

The photosystem II light-harvesting protein Lhcb3 affects the macrostructure of photosystem II and the rate of state transitions in Arabidopsis

Affiliations

The photosystem II light-harvesting protein Lhcb3 affects the macrostructure of photosystem II and the rate of state transitions in Arabidopsis

Jakob T Damkjaer et al. Plant Cell. 2009 Oct.

Abstract

The main trimeric light-harvesting complex of higher plants (LHCII) consists of three different Lhcb proteins (Lhcb1-3). We show that Arabidopsis thaliana T-DNA knockout plants lacking Lhcb3 (koLhcb3) compensate for the lack of Lhcb3 by producing increased amounts of Lhcb1 and Lhcb2. As in wild-type plants, LHCII-photosystem II (PSII) supercomplexes were present in Lhcb3 knockout plants (koLhcb3), and preservation of the LHCII trimers (M trimers) indicates that the Lhcb3 in M trimers has been replaced by Lhcb1 and/or Lhcb2. However, the rotational position of the M LHCII trimer was altered, suggesting that the Lhcb3 subunit affects the macrostructural arrangement of the LHCII antenna. The absence of Lhcb3 did not result in any significant alteration in PSII efficiency or qE type of nonphotochemical quenching, but the rate of transition from State 1 to State 2 was increased in koLhcb3, although the final extent of state transition was unchanged. The level of phosphorylation of LHCII was increased in the koLhcb3 plants compared with wild-type plants in both State 1 and State 2. The relative increase in phosphorylation upon transition from State 1 to State 2 was also significantly higher in koLhcb3. It is suggested that the main function of Lhcb3 is to modulate the rate of state transitions.


Figures
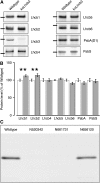
Figure 1.
Figure 1.
Thylakoid Protein Composition of Wild-Type and koLhcb3 Plants. (A) Immunoblotting was performed with monospecific antibodies against Lhcb1, Lhcb2, Lhcb3, Lhcb4 (CP29), Lhcb5 (CP26), Lhcb6 (CP24), PsbA, and PsbS. Lanes were loaded with 1.0 μg chlorophyll; black bars show the location of the 25-kD size marker. (B) Quantification of immunoblot data. Error bars indicate se (n = 4), ** indicates statistically significant differences (P < 0.01) using the Student's t test. (C) Lhcb3 protein levels in the wild type and three different putative koLhcb3 lines (N520342, N661731, and N656120).
Figure 2.
Figure 2.
FPLC Elution Profile of Wild-Type (Solid Line) and koLhcb3 Line N520342 (Dashed Line) Stacked Thylakoid Membranes Solubilized in 0.85% α-DM. The major peaks were identified by their absorption spectra (data not shown). (I) PSII membrane fragments (Tikkanen et al., 2006), (II) PSII supercomplexes, (III) PSI-LHCI, (IV) PSII core, (V) LHCII trimers, (VI) monomeric LHCII, and (VII) displaced pigments.
Figure 3.
Figure 3.
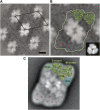
Photosystem II Supercomplex Structure in Wild-Type and koLhcb3 Plants. (A) Projection map of semicrystalline wild-type Arabidopsis PSII-LHCII membranes with the repeating unit (unit cell) indicated by the black diamond. Bar = 10 nm. (B) koLhcb3 line N520342 crystal map showing the C2S2M2 supercomplex particle (white outline) and the position of the S- and M-trimers from the high-resolution x-ray map of LHCII is superimposed on the top trimers (green). The small red dots mark the position of the S- and M-trimers, and the larger red dots surrounding these show positions of high contrast. Blue dots indicate two recognizable densities at the periphery. Inset: A LHCII trimer with comparable densities in EM and x-ray maps indicated with blue dots. (C) Projection map of the wild-type C2S2M2 supercomplex obtained from single particle averaging for comparison (Kouril et al., 2005). Positions within the S- and M-trimers compatible to the crystal two-dimensional map are indicated by red dots.
Figure 4.
Figure 4.
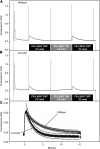
State Transitions in Wild-Type and koLhcb3 Plants. (A) and (B) State transitions in the wild type (A) and koLhcb3 line N520342 (B) Arabidopsis plants. Average room temperature fluorescence traces. The black bar below the trace indicates far-red light OFF (State 2 inducing) treatment and the gray bar below the trace indicates far-red light ON treatment (State 1 inducing). (C) State 1 to State 2 transition induced by PSII light treatment after 15 min PSI light (far red) illumination. Solid lines show exponential decay curve fits, and the dashed lines show se limits, n = 3. The top (light gray) trace shows the wild type, and the bottom (dark gray) trace shows koLhcb3.
Figure 5.
Figure 5.
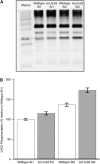
LHCII Phosphorylation in Wild-Type and koLhcb3 Plants. (A) Phosphothreonine immunoblot detection of thylakoid protein phosphorylation. Lanes contain the wild type or the koLhcb3 line N520342 Arabidopsis plants in State 1 or State 2 standardized using 1.0 μg chlorophyll loaded per lane; “25 kD” shows the location of the 25 kD size marker. (B) In vivo LHCII phosphorylation in the wild type (white bars) and koLhcb3 line N520342 (gray bars) Arabidopsis thylakoid isolated following State 1 and State 2 inducing light treatments. Results are normalized to wild-type state 1 phosphorylation, corrected relative to the CP47 phosphorylation signal. Error bars show se, n = 27.
Figure 6.
Figure 6.
Photoacclimation in Wild-Type and koLhcb3 Plants. Fv/Fm ratios in the wild type (circles) and koLhcb3 line N520342 (triangles) of Arabidopsis plants after a shift from growth light (150 μmol photons m−2 s−1) to high light (550 μmol photons m−2 s−1) for 7 d and back to growth light to recovery. Error bars indicate se (n = 6); ratios in high light are fitted to a standard exponential decay function during recovery with a linear function.

Similar articles

Cited by

References

    1. Ahn, T.K., Avenson, T.J., Ballottari, M., Cheng, Y.-C., Niyogi, K.K., Bassi, R., and Fleming, G.R. (2008). Architecture of a charge-transfer state regulating light harvesting in a plant antenna protein. Science 320 794–797. - PubMed
    1. Alboresi, A., Caffarri, S., Nogue, F., Bassi, R., and Morosinotto, T. (2008). In silico and biochemical analysis of Physcomitrella patens photosynthetic antenna: Identification of subunits which evolved upon land adaptation. PLoS One 3 e2033. - PMC - PubMed
    1. Allen, J.F. (2003). State transitions - A question of balance. Science 299 1530–1532. - PubMed
    1. Allen, J.F. (2005). Photosynthesis: The processing of redox signals in chloroplasts. Curr. Biol. 15 929–932. - PubMed
    1. Allen, J.F., and Forsberg, J. (2001). Molecular recognition in thylakoid structure and function. Trends Plant Sci. 6 317–326. - PubMed

Publication types

MeSH terms

Substances