. 2009 Dec;12(12):1524-33.
doi: 10.1038/nn.2416. Epub 2009 Nov 1.

Adult generation of glutamatergic olfactory bulb interneurons

Affiliations

Adult generation of glutamatergic olfactory bulb interneurons

Monika S Brill et al. Nat Neurosci. 2009 Dec.

Erratum in

  • Nat Neurosci. 2010 May;13(5):649

Abstract

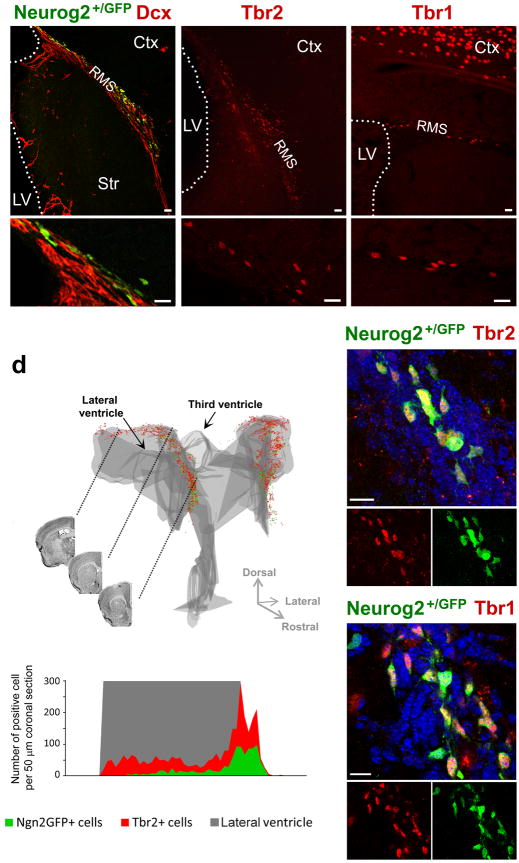
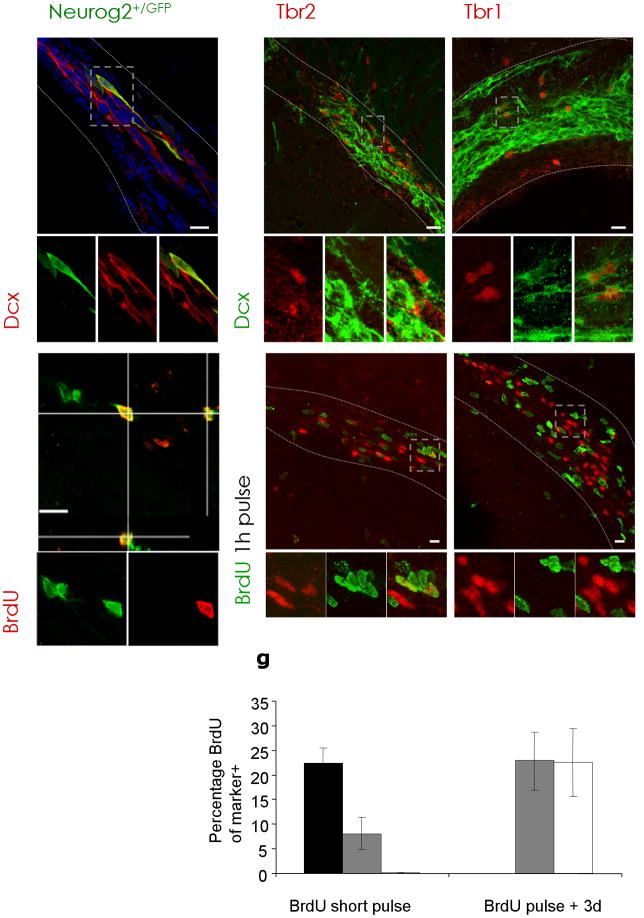
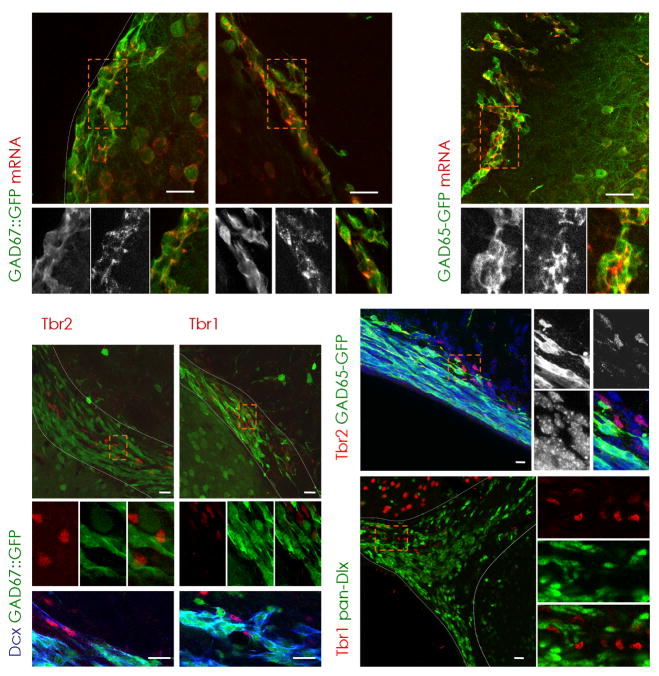
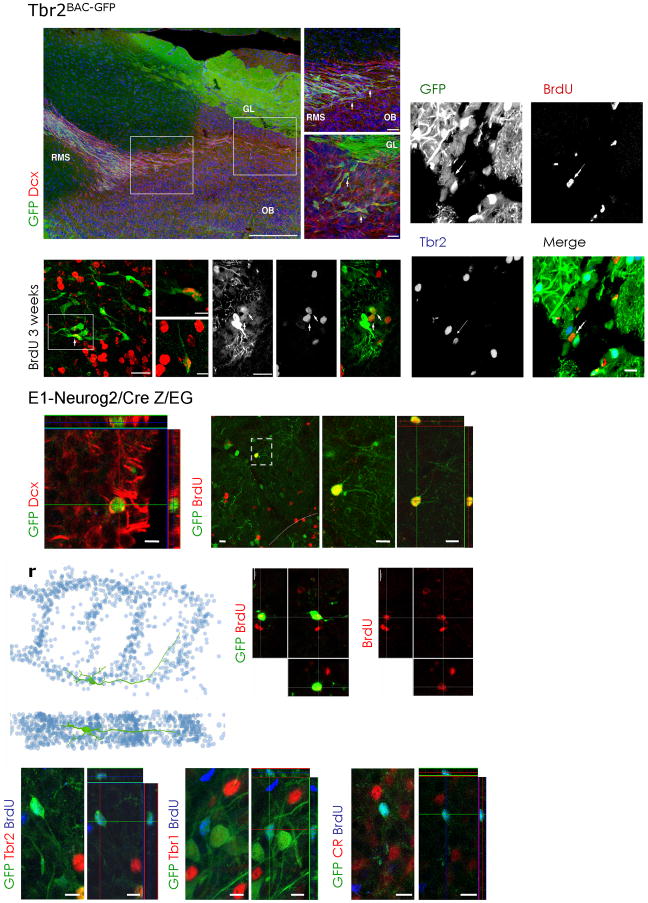
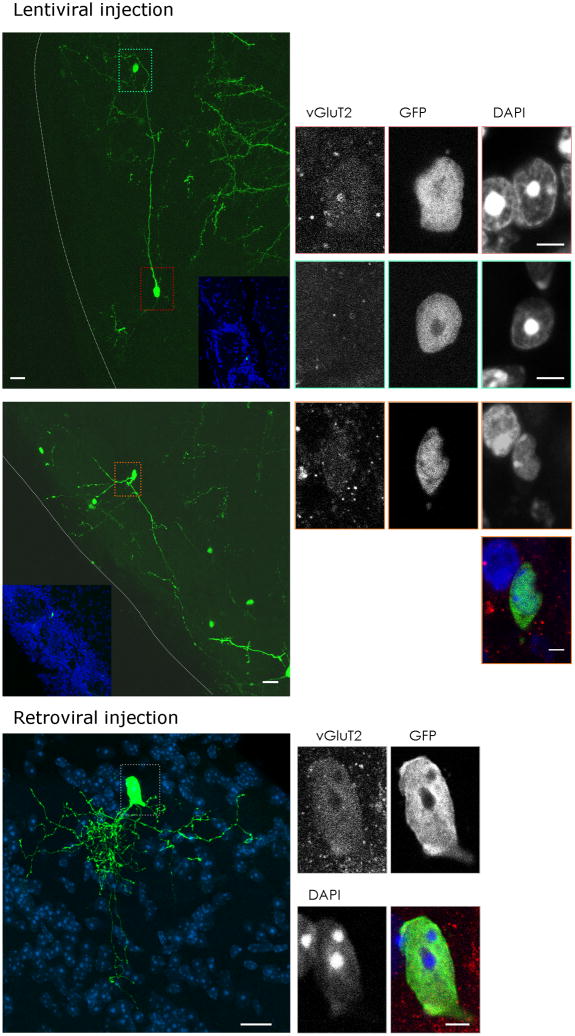
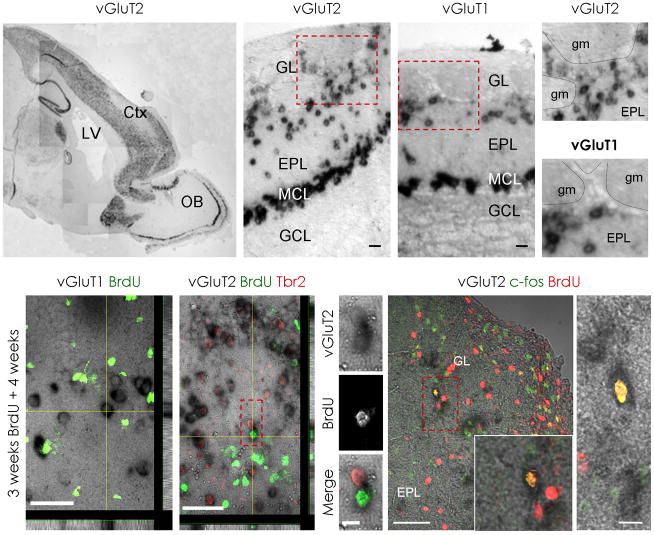
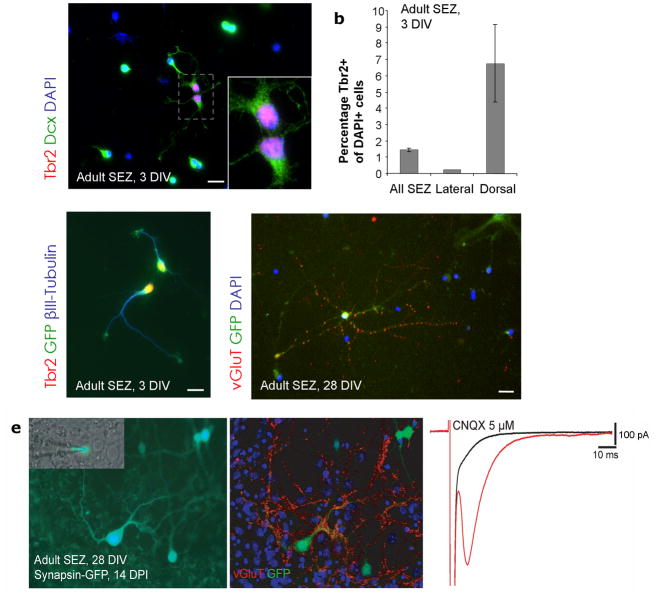
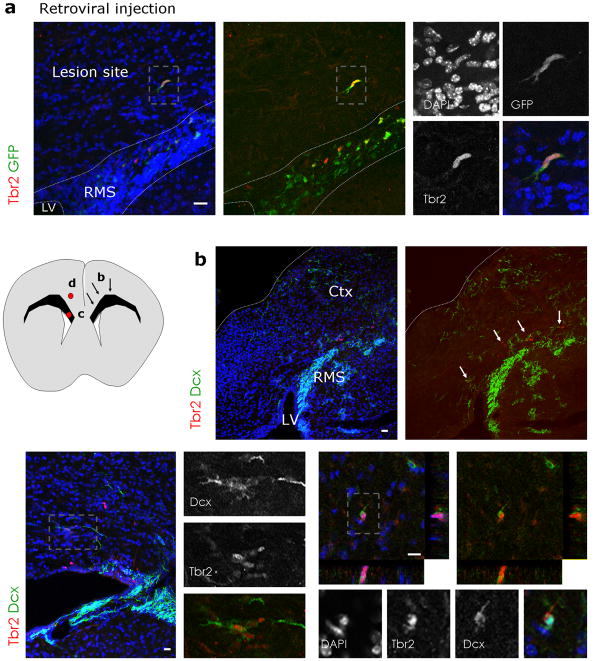
The adult mouse subependymal zone (SEZ) harbors neural stem cells that are thought to exclusively generate GABAergic interneurons of the olfactory bulb. We examined the adult generation of glutamatergic juxtaglomerular neurons, which had dendritic arborizations that projected into adjacent glomeruli, identifying them as short-axon cells. Fate mapping revealed that these originate from Neurog2- and Tbr2-expressing progenitors located in the dorsal region of the SEZ. Examination of the progenitors of these glutamatergic interneurons allowed us to determine the sequential expression of transcription factors in these cells that are thought to be hallmarks of glutamatergic neurogenesis in the developing cerebral cortex and adult hippocampus. Indeed, the molecular specification of these SEZ progenitors allowed for their recruitment into the cerebral cortex after a lesion was induced. Taken together, our data indicate that SEZ progenitors not only produce a population of adult-born glutamatergic juxtaglomerular neurons, but may also provide a previously unknown source of progenitors for endogenous repair.


Figures

Figure 1
Figure 1. Neurog2+/GFP and Tbr1m&2 are expressed in a defined, dorsal region of the SEZ
(a–c) Fluorescent micrographs depicting Neurog2+/GFP-, Tbr2- and Tbr1-positive cells as indicated in the panels in the dorsal SEZ and RMS. (d) 3D-reconstruction of the localization of Neurog2+/GFP- (green) and Tbr2-positive (red) cells in the adult forebrain shows that these progenitors are located in the dorsal SEZ, but not in the lateral wall of the lateral ventricle or third ventricle. Coronal views of three different levels are indicated by the black lines. The histogram below depicts the distribution of Neurog2+/GFP- and Tbr2-positive cells along the rostro-caudal axis. Note that Tbr2-positive cells are more widespread than Neurog2+/GFP-positive cells and that the expression of both markers drops rapidly upon entrance of the cells into the RMS. (e–f) Neurog2+/GFP cells are immunoreactive for (e) Tbr2 and (f) Tbr1. Nuclei are visualized with DAPI (e,f). Ctx = Cortex, LV = lateral ventricle, RMS = rostral migratory stream, Str = Striatum, scale bars: 20 μm.
Figure 2
Figure 2. Neurog2, Tbr1 and Tbr2 expression defines a subset of neuroblasts
(a–c) Fluorescent micrographs depicting Neurog2+/GFP-, Tbr2-, and Tbr1-staining in a subpopulation of Dcx-positive neuroblasts in the RMS and dorsal SEZ; (d–e) depict Neurog2+/GFP- and Tbr2-positive cells labelled with BrdU after a short BrdU pulse, while Tbr1-positive cells (f) are not BrdU-positive. Boxed areas (grey) are shown at higher magnification at the bottom of the panels. (g) Histogram depicting the proportion of Neurog2+/GFP-, Tbr2- and Tbr1-expressing cells in the RMS labelled with BrdU as indicated. Both, Tbr2 and Neurog2+/GFP are detected in fast proliferating cells, while Tbr1-positive cells are labelled only 3 days after BrdU application. (n = 3 animals; cells Neurog2+/GFP, short pulse = 116, cells Tbr1, short pulse = 144, cells Tbr1, 3 days = 190; cells Tbr2, short pulse = 285, cells Tbr2, 3 days = 166). Error bars are presented as s. e. m. dSEZ = dorsal subependymal zone, LV = lateral ventricle, RMS = rostral migratory stream, Str = Striatum, WM = white matter, scalebars: 20 μm.
Figure 3
Figure 3. Presence of Tbr2 and Tbr1 defines a non-GABAergic subpopulation of neuroblasts
(a–c) Virtually all GFP-positive cells in the SEZ (a,c) and RMS (b) are colocalizing with GAD67 (a,b) or GAD65 (c) mRNA in the respective GAD67::GFP and GAD65-GFP mouse lines as indicated in the panels (see Methods). Notably, Tbr2 (d,h) and Tbr1 (e) are absent in GAD65- (h) or GAD67- (d–g) driven GFP-positive cells, but are immunoreactive for the neuroblast marker Dcx in the dorsal SEZ (Tbr2, f) and RMS (Tbr1, g). (i) Consistently, Dlx transcription factors (pan-Dlx, green) are not coexpressed with Tbr1 (red). (a–e,h,i) Boxed areas (orange) are shown at higher magnification. Nuclei are visualized with DAPI (h). dSEZ = dorsal subependymal zone, LV = lateral ventricle, RMS = rostral migratory stream, SEZ = subependymal zone, Str = Striatum, WM = white matter, latSEZ = lateral subependymal zone, scale bars: 20 μm.
Figure 4
Figure 4. Fate mapping of Tbr2- or Neurog2-derived progeny in the olfactory bulb
(a–c) Fluorescent micrographs depicting Tbr2BAC-GFP-positive cells in the RMS and olfactory bulb (green) and Dcx-positive neuroblasts (red). Boxed areas (white) are shown in higher magnifications in (b,c) depicting cells in the RMS entering the olfactory bulb (OB) (b) and on their way to the glomerular layer (GL) (c). (d–i) Fluorescent micrographs depicting examples of BrdU-labelled Tbr2BAC-GFP-positive cells (arrows) that are apparent in the glomerular layer of the olfactory bulb 3 weeks after BrdU labelling. (j–m) Consistently, the BrdU/Tbr2BAC-GFP fate-mapped cells (example indicated by arrow) were negative for Tbr2 protein. Fate mapping of Neurog2 derived progeny in the glomerular layer (GL) of the olfactory bulb using E1- Neurog2/Cre Z/EG mice (n) shows the presence of GFP-positive neuroblasts (Dcx, red). (o–q) BrdU labels juxtaglomerular cells expressing GFP derived from Neurog2 expression (E1- Neurog2/Cre Z/EG). BrdU was given 3 weeks drinking water followed by a 3 weeks BrdU-free period. Boxed area (gey) is shown at higher magnification as (p) Z-projection and (q) as single optical section. (r–t) 3D-reconstruction of the dendritic arborization of a Neurog2-derived adult labelled GFP/BrdU double-positive cell. (s,t) The reconstructed cell is derived from serial sections of a cell labelled for GFP by E1- Neurog2/Cre Z/EG fate mapping and for adult generation by BrdU incorporation (red). BrdU was given for 3 weeks into the drinking water followed by 3 weeks BrdU-free water. (u–z) Note that adult born Neurog2 derived GFP-positive cells that had incorporated BrdU (blue) are negative for Tbr2 (red) (u,v), Tbr1 (red) (w,x) or calretinin (CR, red) (y,z). (u,w,y) are Z-projections, (v,x,z) are single optical sections. EPL = external plexiform layer, GL = glomerular layer, OB = olfactory bulb, RMS = rostral migratory stream, scale bars: 20 μm.
Figure 5
Figure 5. Viral vector mediated fate mapping of vGluT2-expressing juxtaglomerular neurons
(a–i) GFP encoding lentivirus injections into the murine ventricle at the age of 3 weeks resulted in numerous GFP-positive cells in the glomerular layer of the olfactory bulb 6 weeks later. Some GFP-expressing cells had vGluT2-immunoreactivity in their soma ((b–d); red box in (a); (i–l), orange box in (h)), while the majority of GFP-expressing transduced cells were negative for somatic vGluT2-immunoreactivity ((e–g); green-blue box in (a)). (m–q) Retroviral vector injection into dorsal regions of the adult SEZ analyzed 6 weeks post injection also resulted in some GFP-positive juxtaglomerular neurons with somatic vGluT2 (red) immunoreactivity shown in (n–q). Nuclei are visualized with DAPI (d,g,k,l,m,p,q). Insets in (a,h) show an overview of the juxtaglomerular location of the GFP-labelled neurons by counterstaining with DAPI visualizing the glomeruli. (b–g, i–l, n–q) are single optical sections, whereas (a,h,m) are collapsed stacks to show the morphology vGluT2-immunoreactive juxtaglomerular cells. GL = glomerular layer, EPL = external plexiform layer, scale bars: (a,h,m) 20 μm, (b–g, i–l, n–q) 5 μm.
Figure 6
Figure 6. A subpopulation of newly generated juxtaglomerular neurons expresses vGluT2 mRNA
In-situ hybridization for the vesicular glutamate transporter 2 (vGluT2) (a,b,d) or vGluT1 (c,e) mRNA in the adult olfactory bulb shows expression in the mitral cell layer (MCL), external plexiform layer (EPL) and glomerular layer (GL). In contrast, no mRNA signal for vGluT1 nor vGluT2 was detected in the granule cell layer (GCL) (a-c). Boxed areas (red) are shown at higher magnification in (d,e). Note that only vGluT2 mRNA is detected between glomeruli (gm) whereas vGluT1 mRNA is largely restricted to the external plexiform layer underlying the glomerular layer. (f) depicts a micrograph with BrdU-immunofluorescence in green and vGluT1 mRNA in black. Note that vGluT1-expressing cells do not incorporate BrdU. (g) depicts an example of vGluT2-expressing juxtaglomerular cell labelled by BrdU (green) that is Tbr2-negative (red). Boxed area (red) is shown in higher magnification in (h–j). (k,l) depict two examples of vGluT2-expressing cells that incorporated BrdU (red) and are immunopositive for c-fos (green). Boxed area in (k) (red) is shown at higher magnification at the lower right corner of the panel. Z-projections in (f) and (g) are shown below and to the right of the panels. Ctx = Cortex, GL = glomerular layer, EPL = external plexiform layer, LV = lateral ventricle, MCL = mitral cell layer, GCL = granule cell layer, gm = glomerulus, OB = olfactory bulb, scale bars: (b,c,l) 20 μm, (h–j) 10 μm, (f,g) 50μm, (k) 100 μm.
Figure 7
Figure 7. Adult SEZ stem and progenitor cells give rise to some glutamatergic neurons in vitro
(a) Example of two SEZ neuroblasts expressing Dcx (green) and Tbr2 (red) after 3 days in vitro (3 DIV). Boxed area shows Tbr2-positive nuclei at higher magnification in the lower right corner of the panel. (b) Quantification of Tbr2-positive nuclei in cultured SEZ stem and progenitor cells isolated from the dorsal, lateral or both walls of the lateral ventricle after 3 days in vitro. Tbr2-positive cells are enriched in cultures derived from the dorsal SEZ. (n = 3 experiments; dorsal cultures 471 cells, ventral cultures 602 cells, and mixed cultures 1384 cells counted, error bars are presented as s. e. m.) (c) Cells double-positive for Tbr2 (red) and βIII-Tubulin (blue) originate from proliferating progenitors as indicated by the transduction with a GFP-encoding retrovirus shortly after plating. (d) vGluT (red) immunoreactivity was also detected in GFP-positive cells 4 weeks after retroviral transduction indicating their origin from proliferating progenitors. (e) Left: micrograph shows an adult SEZ derived glutamatergic neuron transduced with a lentiviral vector expressing GFP under the synapsin promotor that was patched by the recording electrode (inset); middle: immunostaining for vGluT and GFP after recording shows that this cell is highly decorated with vGluT positive puncta; right: stimulation of the neuron evoked an autaptic response that was blocked by the AMPA/kainate receptor antagonist CNQX revealing its glutamatergic nature. Nuclei are visualized with DAPI (a,d). Scale bars: 20 μm
Figure 8
Figure 8. Tbr2-positive cells migrate into the lesioned cerebral cortex
(a) Retroviral injections of GFP encoding vectors 2 days prior to laser illumination result in GFP-positive cells that migrated away from the RMS 3 – 4 days after lesion, some of which are Tbr2-immunoreactive (red). (b) Fluorescence micrograph depicting Tbr2- and Dcx-immunopositive cells in an overview of the lesioned cerebral cortex hemisphere and the RMS one week after Chlorine e6 induced lesion. The schematic drawing to the left depicts the location of the arrows in (b) on the right side and the location of the micrographs (c,d) on the left side. Tbr2-and Dcx-positive cells are present in dorsal regions of the SEZ/RMS (white arrows in (c)) and are sometimes found in small clusters (c) or in the cortical grey matter (d). Boxed areas (grey) are shown at higher magnifications. Nuclei are visualized with DAPI (a–d). Ctx = cortex, LV = lateral ventricle, RMS = rostral migratory stream, scale bars: (a,c,d) 20 μm, (b) 50 μm.

Comment in

Similar articles

Cited by

References

    1. Kokaia Z, Lindvall O. Neurogenesis after ischaemic brain insults. Curr Opin Neurobiol. 2003;13:127–32. - PubMed
    1. Sohur US, Emsley JG, Mitchell BD, Macklis JD. Adult neurogenesis and cellular brain repair with neural progenitors, precursors and stem cells. Philos Trans R Soc Lond B Biol Sci. 2006;361:1477–97. - PMC - PubMed
    1. Ming GL, Song H. Adult neurogenesis in the mammalian central nervous system. Annu Rev Neurosci. 2005;28:223–50. - PubMed
    1. Gage FH. Mammalian neural stem cells. Science. 2000;287:1433–8. - PubMed
    1. Merkle FT, Mirzadeh Z, Alvarez-Buylla A. Mosaic organization of neural stem cells in the adult brain. Science. 2007;317:381–4. - PubMed

Publication types

MeSH terms