. 2009 Dec;10(12):1267-74.
doi: 10.1038/ni.1816. Epub 2009 Nov 1.

T cell-intrinsic role of Nod2 in promoting type 1 immunity to Toxoplasma gondii

Affiliations

T cell-intrinsic role of Nod2 in promoting type 1 immunity to Toxoplasma gondii

Michael H Shaw et al. Nat Immunol. 2009 Dec.

Abstract

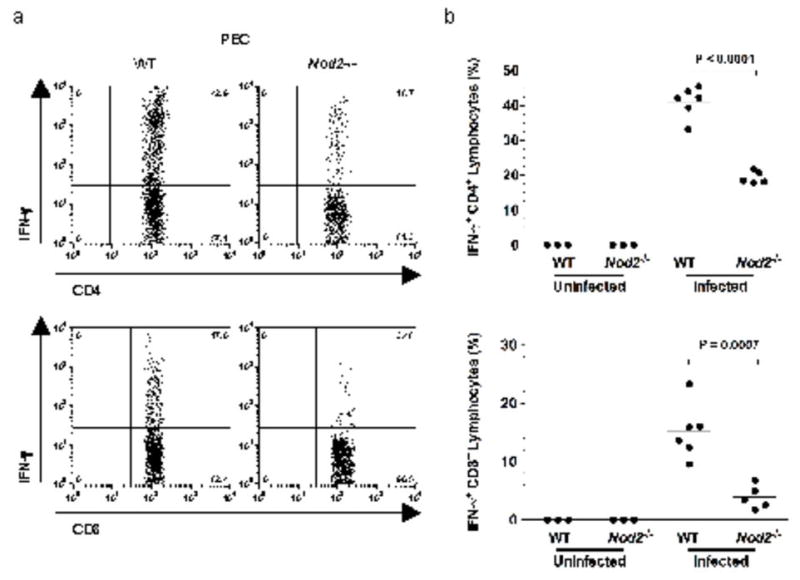
Nod2 belongs to the nucleotide-binding oligomerization domain receptor (NLR) family of proteins, which function as intracellular pathogen sensors in innate immune cells. Nod2 deficiency results in an impaired immune response to bacterial pathogens. However, how this protein promotes host defense against intracellular parasites is unknown. Here we found that Nod2(-/-) mice had less clearance of Toxoplasma gondii and lower interferon-gamma (IFN-gamma) production. Reconstitution of T cell-deficient mice with Nod2(-/-) T cells followed by T. gondii infection demonstrated a T cell-intrinsic defect. Nod2(-/-) CD4(+) T cells had poor helper T cell differentiation, which was associated with impaired production of interleukin 2 (IL-2) and nuclear accumulation of the transcription factor subunit c-Rel. Our data demonstrate a T cell-intrinsic role for Nod2 signaling that is critical for host defense against T. gondii.


Figures

Figure 1
Figure 1
Nod2 in host defense against T. gondii infection. Wild-type (WT), Nod2−/−, RICK−/− and Ifng−/− mice were challenged i.p. with 20 cysts of the ME49 strain of T. gondii. (a) Survival was monitored over 30 days. (b) The percentage of tachyzoite-infected peritoneal exudate cells (PEC) was enumerated on day 7. (c) Cytospins of PECs from day 12 infected wild-type and Nod2−/− mice were prepared and stained to visualize intracellular parasites (left panels 20× magnification; right panles 100× magnification; arrows indicate parasites). (d) On day 12 post-challenge, the percentage of infected PECs in infected wild-type and Nod2−/− mice was determined. In (a) the P value was determined using the Mantel-Cox log-rank test and is representative of at least four similar experiments with 5–20 mice per group. In (b-d) values shown are the mean ± s.d. of infected PECs and are representative of at least three experiments with 3–5 mice per group.
Figure 2
Figure 2
Nod2-deficient mice exhibit impaired IFN-γ production despite normal IL-12p40 production. Serum from T. gondii-infected wild-type, Nod2−/−, and Ifng−/− mice were collected on day 0, 3, 5 and 7 post-inoculation and the concentrations of (a) IL-12p40 and (b) IFN-γ were determined by ELISA. The horizontal bars represent the mean of 5–10 mice per group and are representative of at least three independent experiments.
Figure 3
Figure 3
Nod2-deficient mice exhibit impaired type I immune responses during T. gondii infection. (a) CD4+ and CD8+ lymphocytes among PECs from CPS-immunized wild-type and Nod2−/− mice were stimulated for 6 h in vitro with live CPS tachyzoites. IFN-γ production was measured by flow cytometry. Each dot-plot is gated on CD4+TCR-β+ cells and is from one representative mouse per group (n = 3–6 mice per group). (b) Data shown in (a) were pooled; each dot represents one mouse and horizontal bars represent the mean. All data shown are representative of at least three experiments with 3–6 mice per group and all mice were analyzed individually by flow cytometry.
Figure 4
Figure 4
DC function during T. gondii infection is unaffected in the absence of Nod2. (a) Left, FACs sorted CD4+ T cells from the peritoneal cavity of day 9 CPS-immunized wild-type and Nod2−/− mice were stimulated for 6 h with or without wild-type or Nod2−/− BMDCs that were infected with T. gondii. IFN-γ production was measured by flow cytometry. Each dot-plot is gated on CD4+TCR-β+ cells and is from one representative mouse per group (n = 3–4 mice per group). Right, data were pooled; each dot represents one mouse and horizontal bars represent the mean. (b) IFN-γ secretion by peritoneal CD4+ cells was determined as described in (a), but cells were restimulated for 24 h in vitro. (c) Left, MACS-sorted splenic CD4+ cells from naïve wild-type (Thy-1.1) mice were injected intravenously into wild-type (Thy-1.2) or Nod2−/− (Thy-1.2) recipients, which were then challenged i.p. with irradiated CPS parasite. On day 9 post-infection, PECs were isolated and IFN-γ production by donor CD4 cells was determined by intracellular cytokine staining (left; dot plots were gated on CD4+TCRβ+Thy-1.1+ cells). Right, the data were pooled; each dot represents one mouse and horizontal bars represent the mean.
Figure 5
Figure 5
Nod2−/− CD4 cells have an intrinsic defect in IFN-γ production. (a) Left, MACS-sorted splenic CD4+ cells from wild-type (Thy-1.1) and Nod2−/− (Thy-1.1) mice were injected intravenously into wild-type Tcrb−/− (Thy-1.2) or Nod2−/−Tcrb−/− (Thy-1.2) recipients, which were then challenged with irradiated CPS parasites. On day 9 post challenge, PECs were harvested from reconstituted mice and IFN-γ production was determined by intracellular cytokine staining following in vitro stimulation with live parasite. Each dot plots is representative of 4–8 mice per group and is gated on CD4+TCR-β+Thy-1.1+ cells. Right, the data were pooled; each dot represents one mouse and horizontal bars represent the mean. (b) PECs of reconstituted mice as described in (a) were co-cultured with live parasite for 24 h and IFN-γ in the supernatants was determined by ELISA.
Figure 6
Figure 6
Impaired TH cell differentiation and IL-2 production by Nod2−/− T cells. (a) Purified wild-type OT-II and Nod2−/− OT-II cells were co-incubated in vitro with OVA-loaded BMDCs. At the indicated time points, the expression of CD25, CD44 and CD62L was determined by flow cytometry. The numbers in (a) represent the percentage of T cells in each gate or quadrant. (b) Wild-type OT-II and Nod2−/− OT-II cells were co-cultured with wild-type or Nod2−/− BMDCs loaded with varying doses of OVA for 3 days. IL-2 in the culture supernatant was measured by ELISA. (c,d) Splenic wild-type OT-II and Nod2−/− OT-II cells were purified and cultured with OVA-loaded wild-type BMDCs in TH1 or TH2 polarizing conditions in the presence or absence of exogenous IL-2. Efficiency of polarization was determined on day 6 based on IFN-γ (TH1) and IL-4 (TH2) production following α-CD3 restimulation for 24 h. All data shown are representative of at least three experiments with 3–4 mice per group. (b-d) Values shown are the mean ± s.d. from three mice pre-group.
Figure 7
Figure 7
Role for Nod2 in T cell-induced colitis. (a) Body weights of Rag1−/− recipients of purified CD4+CD25CD45RBhi T cells from Nod2−/− or wild-type mice, represented as percent of initial (day 0) weight. (b) Gross morphology of the colon from the recipient mice in (a) at eight weeks post reconstitution. (c) Left, histology of small intestine and colonic tissues from the mice in (a). Right, severity of intestinal inflammation in the mice in (a) was assessed by histologic scoring on three major categories (extent of epithelial damage, level of involvement, and inflammatory cell infiltration). (d) Mesenteric lymph nodes were harvested from the mice in (a) and restimulated with α-CD3 for 24 h. IFN-γ concentrations in the culture supernatants were determined by ELISA. Data shown are representative of two experiments with n=5 mice per group. * P< 0.05; ** P < 0.005; *** P < 0.0005; † P < 0.0001.
Figure 8
Figure 8. Nod2 interacts with c-Rel and enhances Il2 transcription
(a) HEK293T cells were transiently transfected with 1μg of the indicated expression plasmids. Cells were harvested after 48 h and whole cell lysates were immunoprecipitated with antibodies against NIK or HA (Nod2) (left) or Flag (Nod2 or CARMA1) (right). Bcl10 was used as a specificity control. The immunoprecipitates were subjected to SDS-PAGE and immunoblotting with the indicated antibodies. (b) Jurkat cells were transiently transfected with a luciferase reporter driven by a CD28 response element, along with equivalent amounts of Nod2, NIK, and c-Rel expression constructs as indicated. The cells were stimulated with anti-CD3 and anti-CD28 and the average relative luciferase activity is shown (±s.d.). A renilla luciferase reporter construct was used to normalize for transfection efficiency and the results are representative of three independent experiments. (c) Nuclear and cytosolic fractions from purified T cells stimulated with plate-bound α-CD3 and α-CD28 for 1–9 h were subjected to SDS-PAGE, followed by immunoblotting with the indicated antibodies. The results are representative of three similar experiments.

Comment in

  • T cells need Nod too?
    Salek-Ardakani S, Croft M. Salek-Ardakani S, et al. Nat Immunol. 2009 Dec;10(12):1231-3. doi: 10.1038/ni1209-1231. Nat Immunol. 2009. PMID: 19915621 Free PMC article.

References

    1. Shaw MH, Reimer T, Kim YG, Nunez G. NOD-like receptors (NLRs): bona fide intracellular microbial sensors. Curr Opin Immunol. 2008;20:377–382. - PMC - PubMed
    1. Chen G, Shaw MH, Kim YG, Nunez G. NOD-like receptors: role in innate immunity and inflammatory disease. Annu Rev Pathol. 2009;4:365–398. - PubMed
    1. Denkers EY, Gazzinelli RT, Martin D, Sher A. Emergence of NK1.1+ cells as effectors of IFN-gamma dependent immunity to Toxoplasma gondii in MHC class I-deficient mice. J Exp Med. 1993;178:1465–1472. - PMC - PubMed
    1. Denkers EY, Gazzinelli RT. Regulation and function of T-cell-mediated immunity during Toxoplasma gondii infection. Clin Microbiol Rev. 1998;11:569–588. - PMC - PubMed
    1. Yarovinsky F, et al. TLR11 activation of dendritic cells by a protozoan profilin-like protein. Science. 2005;308:1626–1629. - PubMed

Publication types

MeSH terms