. 2009 Nov 4;97(9):2577-84.
doi: 10.1016/j.bpj.2009.08.032.

Large structural change in isolated synaptic vesicles upon loading with neurotransmitter

Affiliations

Large structural change in isolated synaptic vesicles upon loading with neurotransmitter

Kristi L Budzinski et al. Biophys J. .

Abstract

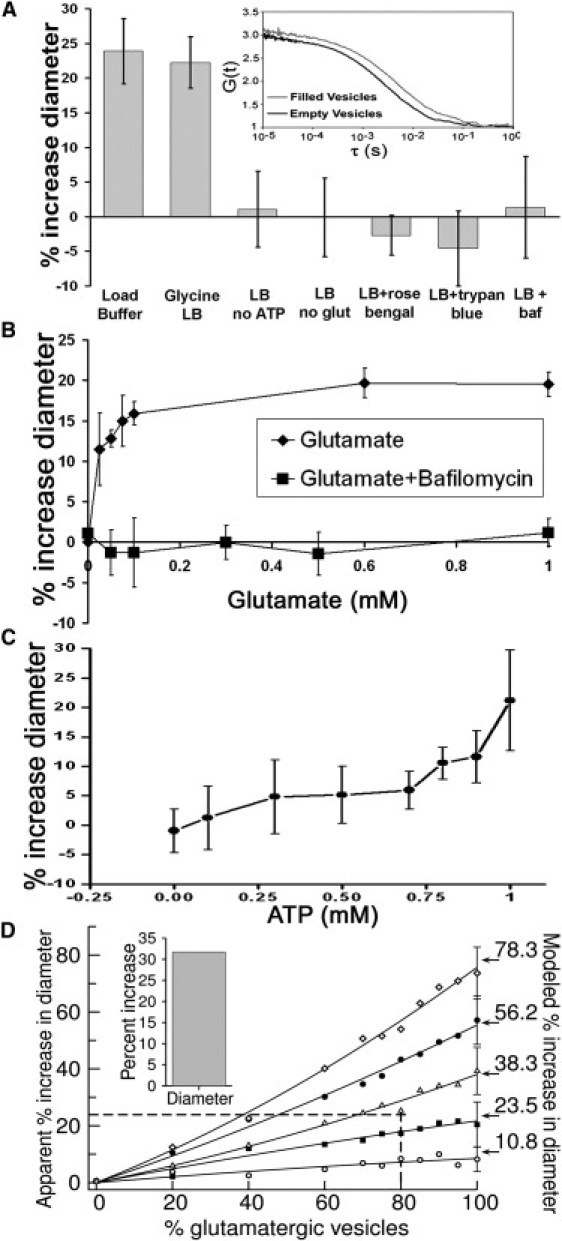
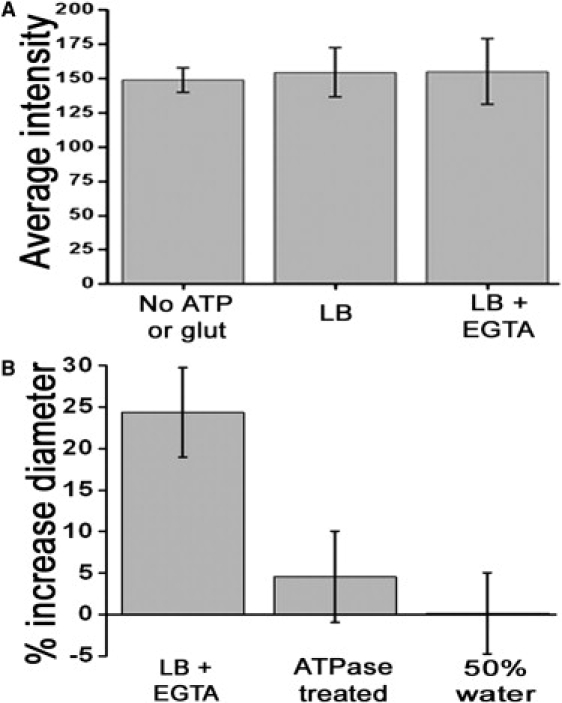
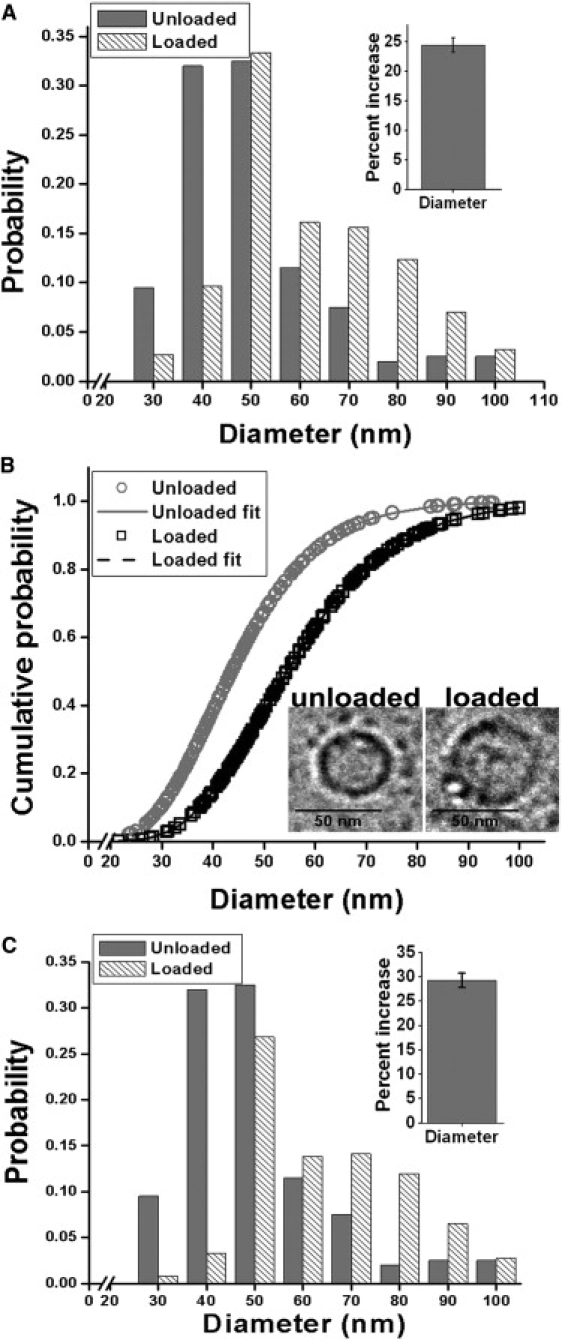
The size of a synaptic vesicle (SV) is generally thought to be determined by the amount of lipid and membrane protein it contains. Once formed, it is thought to remain constant in size. Using fluorescence correlation spectroscopy and cryogenic electron microscopy, we show that glutamatergic vesicles reversibly increase their size upon filling with glutamate. The increase ( approximately 25% in diameter) corresponds to an increase in surface area of approximately 50% and in volume of approximately 100%. This large size increase implies a large structural change in the SV upon loading with neurotransmitters. Vesicles lacking SV protein 2A (SV2A) did not manifest a change in size after loading with glutamate, indicating that SV2A is required for this phenomenon.


Figures

Figure 1
Figure 1
FCS setup and method. (A) Schematic of the in-house built instrument used to perform FCS. DC: dichroic mirror; APD: avalanche photodiode; BP: bandpass filter. (B) Typical raw time trace of the fluorescence signals obtained from antibody-labeled SVs and (C) the corresponding autocorrelation function. (D) Calibration plot for our FCS instrument using fluorescent beads of known diameters (24 ± 4 nm, 36 ± 5 nm, 60 ± 3 nm, and 210 ± 10 nm, ± SD). The hydrodynamic diameters of four different-sized polystyrene beads were measured to ensure that the FCS setup was calibrated for a wide range of sizes. The linear correlation coefficient is 0.99.
Figure 2
Figure 2
SVs show an increase in size upon loading with glutamate. All plots show percent change ± SD of percent change. (A) Plot showing the change in hydrodynamic diameter of rat SVs under various loading conditions. The LB consisted of 10 mM HEPES, 4 mM KCl, 4 mM MgSO4, 320 mM sucrose, 1 mM ATP, and 1 mM glutamate at pH 7.4; ATP and glutamate were added separately and the vesicles were allowed to load for 10 min at room temperature. The glycine LB (buffer used in cryo-EM) consisted of 10 mM HEPES, 4 mM KCl, 4 mM MgSO4, 230 mM glycine, 1 mM ATP, and 1 mM glutamate at pH 7.4. “LB no ATP”: LB without ATP; “LB no glut”: LB without glutamate; “LB + rose Bengal”: LB with 1 μM rose Bengal; “LB + trypan blue”: LB with 1.25 μM Trypan blue; “LB + baf”: LB with 0.6 mM bafilomycin. Inset shows the visible difference in the autocorrelation function between “unloaded” vesicles and “loaded” vesicles. (B) Graph showing percent increase in hydrodynamic diameter of loaded SVs as a function of the extravesicular glutamate concentration; ATP concentration was 1 mM for all, and bafilomycin concentration was 0.6 mM for the lower curve. (C) Graph showing the percent increase in hydrodynamic diameter of loaded vesicles as a function of extravesicular ATP concentration; glutamate concentration was 1 mM for all. (D) Simulation showing the apparent increase in hydrodynamic diameter versus percentage of glutamate vesicles in our FCS samples. The simulated unloaded and nonglutamatergic vesicles in the sample have a hydrodynamic diameter of 60 nm, whereas the loaded glutamate vesicles were simulated with hydrodynamic diameters of (○) 66.5, (■) 74.1, (Δ) 83.0, (•) 93.7, and (◊) 107.0 nm. Each point for 60–100% glutamatergic vesicles is the average of best-fit results for 18 simulations. The results for the 20% and 40% points are the average from six simulations. The result for the 0% point is the average from 12 simulations. The diameters have all been converted to percent increases (shown on the right of the plot) for comparison with our experimental measurements. Typical values of the SD of the best fit results are shown for some of the points, and solid lines have been drawn to guide the eye. The horizontal dashed line was drawn at 23.9% increase, the measured percent increase in the hydrodynamic diameter of the loaded SVs measured by FCS. The vertical dashed line is drawn at 80%, which is the estimate of the percentage of glutamatergic vesicles. The intersection of the two dashed lines is used to estimate the percentage increase of the hydrodynamic diameter of the glutamatergic vesicles only.
Figure 3
Figure 3
SVs are not aggregated or fused under our measurement conditions. (A) A plot of the average fluorescence intensity (arbitrary units) ± SD of SVs as they transit the laser probe volume under the three conditions indicated on the x axis. All measurements were performed in LB consisting of 10 mM HEPES, 4 mM KCl, 4 mM MgSO4, 320 mM sucrose, 1 mM ATP, and 1 mM glutamate at pH 7.4, except for “Unloaded” vesicles, which were in LB without glutamate and ATP, and “Loaded w/ EGTA” vesicles, which were in LB plus 1 mM EGTA. (B) Vesicles loaded under the following conditions: 1, LB plus 1 mM EGTA (“EGTA”); 2, loaded in LB and then treated with 0.6U ATPase (“ATPase”) for 2 min; and 3, unloaded vesicles diluted 50% by the addition of distilled water (“50% Water”). The plot gives the percent change ± SD of percent change. For all experiments, loading was performed at room temperature for 10 min.
Figure 4
Figure 4
Cryo-EM measurements of vesicle diameter reveal an increase in size upon glutamate loading. (A) Histogram showing the distribution of diameters for unloaded and loaded SVs in glycine LB (10 mM HEPES, 4 mM KCl, 4 mM MgSO4, 230 mM glycine, 1 mM ATP, and 1 mM glutamate at pH 7.4). Inset shows percent increase in diameter for loaded vesicles. (B) Cumulative probability plot of diameters for unloaded and loaded vesicles. Plots were fit with a lognormal distribution to obtain a diameter of 45.7 ± 13.9 nm (mean ± SD) for unloaded and 56.9 ± 17.1 nm for loaded vesicles. Inset shows representative pictures for unloaded and loaded vesicles. (C) Histogram showing the distribution in diameters for glutamatergic vesicles only, which was calculated by subtracting from each size bin 20% of the number of empty vesicles (shaded bars) from the number of loaded vesicles (hatched bars); inset shows this corrected percent increase in diameter for loaded glutamatergic vesicles.
Figure 5
Figure 5
Dependence of vesicle size increase on the presence of SV2A. (A) A bar plot showing the increase in vesicle size requires SV2A. SVs isolated from WT mice, heterozygous SV2A mice (AHet), SV2A knockout mice (AKO), or SV2A/SV2B double knockout mice (DKO) were loaded at room temperature for 10 min in LB (10 mM HEPES, 4 mM KCl, 4 mM MgSO4, 320 mM sucrose, 1 mM ATP, and 1 mM glutamate at pH 7.4). These vesicles were all labeled with antibodies against synaptotagmin. (B) Western blot comparing SV2A and synaptophysin content in WT mice, AHet mice, and AKO mice. The bar graph shows the ratio of SV2A expression versus the expression of synaptophysin, a common SV marker protein, normalized to the expression level in WT mice. Proteins were probed with a polyclonal antibody directed against SV2A and a polyclonal antibody directed against synaptophysin. As anticipated, AHet vesicles (n = 4) have about half the amount of expressed SV2A as WT vesicles (n = 4), whereas vesicles from AKO (n = 3) mice contain no SV2A. All vesicles exhibited similar levels of synaptophysin.
Figure 6
Figure 6
Models of SV expansion. (A) Island model. In this model (left), nonexpandable components (most likely lipids) are modeled as white islands corresponding to ∼65% of the surface area. The remaining surface area (gray) represents expandable components, most likely proteins. Loading glutamate causes the protein “sea” to expand, whereas the “islands” do not change size appreciably. Holes may form in the islands or the sea, but can be plugged by expansion of the internal matrix. The expanded model (right) represents a ∼25% increase in diameter. The size, shape, and arrangement of islands in these depictions are arbitrary. (B) Our model is analogous to the reversible expansion of CCMV. Three-dimensional reconstructions of the unexpanded (left) and expanded (right) states are shown (23). Unexpanded CCMV is ∼29 nm in diameter and is formed by pentameric (white arrowhead) and hexameric (black arrowhead) oligomers known as capsomeres. The expanded form is ∼20% larger in diameter. SVs could expand in a similar manner. Analogously to the “islands” in our model, the cores of CCMV hexamers and pentamers remain the same size, whereas the intercapsomere connections expand. In CCMV, the expandable intercapsomere connections are protein domains. (C) Matrix-swelling model. In this model, the vesicle size increase is caused by expansion of the internal matrix upon glutamate loading. The internal matrix expands and pushes the membrane outward, possibly causing the formation of holes in the membrane (shown as brackets in the membrane). Loaded glutamate is held in the internal matrix, thus keeping the vesicle from leaking glutamate after the expansion occurs.

References

    1. Takamori S., Holt M., Stenius K., Lemke E.A., Gronborg M. Molecular anatomy of a trafficking organelle. Cell. 2006;127:831–846. - PubMed
    1. Sudhof T.C. The synaptic vesicle cycle. Annu. Rev. Neurosci. 2004;27:509–547. - PubMed
    1. Daniels R.W., Collins C.A., Chen K., Gelfand M.V., Featherstone D.E. A single vesicular glutamate transporter is sufficient to fill a synaptic vesicle. Neuron. 2006;49:11–16. - PMC - PubMed
    1. Colliver T.L., Pyott S.J., Achalabun M., Ewing A.G. VMAT-mediated changes in quantal size and vesicular volume. J. Neurosci. 2000;20:5276–5282. - PMC - PubMed
    1. Needham D., Nunn R.S. Elastic deformation and failure of lipid bilayer membranes containing cholesterol. Biophys. J. 1990;58:997–1009. - PMC - PubMed

Publication types

LinkOut - more resources