. 2010 Feb 21;262(4):679-90.
doi: 10.1016/j.jtbi.2009.10.030. Epub 2009 Oct 31.

Modeling species-specific diacylglycerol dynamics in the RAW 264.7 macrophage

Affiliations

Modeling species-specific diacylglycerol dynamics in the RAW 264.7 macrophage

Hannah L Callender et al. J Theor Biol. .

Abstract

A mathematical model of the G protein signaling pathway in RAW 264.7 macrophages downstream of P2Y(6) receptors activated by the ubiquitous signaling nucleotide uridine 5'-diphosphate is developed. The model, which is based on time-course measurements of inositol trisphosphate, cytosolic calcium, and diacylglycerol, focuses particularly on differential dynamics of multiple chemical species of diacylglycerol. When using the canonical pathway representation, the model predicted that key interactions were missing from the current network structure. Indeed, the model suggested that accurate depiction of experimental observations required an additional branch to the signaling pathway. An intracellular pool of diacylglycerol is immediately phosphorylated upon stimulation of an extracellular receptor for uridine 5'-diphosphate and subsequently used to aid replenishment of phosphatidylinositol. As a result of sensitivity analysis of the model parameters, key predictions can be made regarding which of these parameters are the most sensitive to perturbations and are therefore most responsible for output uncertainty.


Figures

Figure 1
Figure 1
Timecourse of stimulation with 25 µM UDP in RAW 264.7 cells. Solid black lines represent model simulations for the system of equations using the two-pool model (with Eq. (7) and Eq. (8)), whereas gray lines represent simulations using the canonical pathway for DAG (Eq. (6)). (A) 38:4 DAG response (representative of the response of most polyunsaturated fatty acid-containing DAG species). (B) 34:1 DAG response (representative of the response of most mono- and di-unsaturated fatty acid-containing DAG species). Data points in (A) and (B) contain nine replicates performed on three different experimental days, with error bars = mean ± 1 SE. Units are total change in ng over baseline levels in ~ 8×10⁶ cells. (C) IP3 response in pmols per ~ 4.5×10⁵ cells. Points represent the average of four experiments, and error bars = mean ± 1 SE. (D) Ca2+ response in µM. Red curve is a representative Ca2+ trace taken from the UDP experiments within the AfCS single ligand screen as described in the “Intracellular free calcium assay” portion of the Methods section.
Figure 1
Figure 1
Timecourse of stimulation with 25 µM UDP in RAW 264.7 cells. Solid black lines represent model simulations for the system of equations using the two-pool model (with Eq. (7) and Eq. (8)), whereas gray lines represent simulations using the canonical pathway for DAG (Eq. (6)). (A) 38:4 DAG response (representative of the response of most polyunsaturated fatty acid-containing DAG species). (B) 34:1 DAG response (representative of the response of most mono- and di-unsaturated fatty acid-containing DAG species). Data points in (A) and (B) contain nine replicates performed on three different experimental days, with error bars = mean ± 1 SE. Units are total change in ng over baseline levels in ~ 8×10⁶ cells. (C) IP3 response in pmols per ~ 4.5×10⁵ cells. Points represent the average of four experiments, and error bars = mean ± 1 SE. (D) Ca2+ response in µM. Red curve is a representative Ca2+ trace taken from the UDP experiments within the AfCS single ligand screen as described in the “Intracellular free calcium assay” portion of the Methods section.
Figure 2
Figure 2
Proposed two-pool model for DAG kinetics post-agonist stimulation with UDP. Initial production of a single species of DAG from the hydrolysis of PIP2 in pool 1 (plasma membrane) is offset by phosphorylation of DAG by a DAG kinase in pool 2 (which we conjecture to be the Endoplasmic Reticulum) to aid in the replacement of PI. The second wave of DAG is a result of resynthesis of PIP2, which is then hydrolyzed to form DAG and IP3. While production of each species of DAG will follow this diagram, experimental data suggests that rates of production, degradation and transition between the pools vary between species. Abbreviations not mentioned in the text are as follows: PI4K, phosphatidylinositol 4-kinase; PI5K, phosphatidylinositol 5-kinase; DGK, DAG kinase; LPP, lipid phosphate phosphatase; IP4, inositol 4-phosphate; IP2, inositol diphosphate; IP, inositol phosphate; MAG, monoacylglycerol; TAG, triacylglycerol; GPL, glycerophospholipid; CDS, CDP-DAG synthase; PIS, phosphatidylinositol synthase; Ins, inositol.
Figure 3
Figure 3
Model simulations for timecourse of stimulation with 25 µM UDP in a single RAW 264.7 cell for remaining model variables. (A) Activated (solid line) and inactivated (dashed line) P2Y6 surface receptors. (B) Total number of activated Gα·GTP. (C) Total number of PIP2 available for hydrolysis.
Figure 3
Figure 3
Model simulations for timecourse of stimulation with 25 µM UDP in a single RAW 264.7 cell for remaining model variables. (A) Activated (solid line) and inactivated (dashed line) P2Y6 surface receptors. (B) Total number of activated Gα·GTP. (C) Total number of PIP2 available for hydrolysis.
Figure 4
Figure 4
Standardized Regression Coefficients (SRCs) corresponding to most sensitive parameters for IP3. Most sensitive parameters are as follows: receptor rate of phosphorylation, kp (formula image
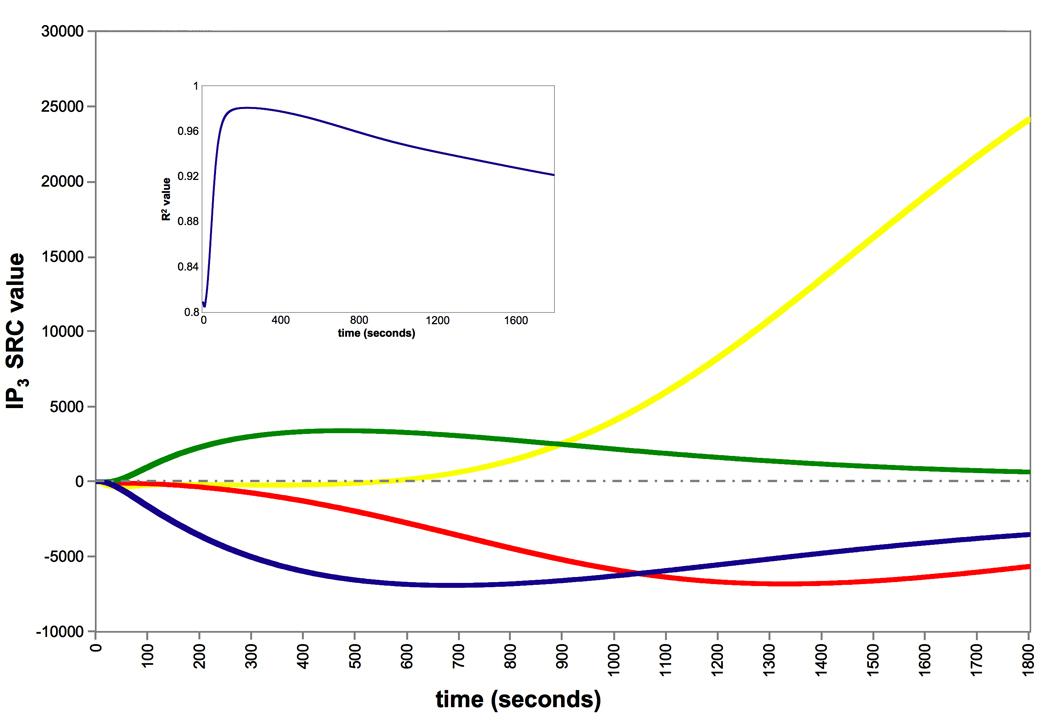
), receptor recycling rate, kr (formula image), PIP2 replenishment rate, krep (formula image), and IP3 degradation rate, kd3 (formula image). Inset: Ry2 values for all time points are ≥ 0.8, enusuring that the SRCs for IP3 are good measures of sensitivity.
Figure 5
Figure 5
Standardized Regression Coefficients (SRCs) corresponding to most sensitive parameters for DAG. Most sensitive parameters are as follows: degradation rate of DAGp1, kdp1 (formula image), production rate of DAGp2, kap2 (formula image), degradation rate of DAGp2, kdp2 (formula image), receptor rate of phosphorylation, kp (formula image), and receptor recycling rate, kr (formula image). Inset: Since Ry2 values for all time points are ≥ 0.95, the SRCs for DAG are good measures of sensitivity.
Figure 6
Figure 6
Changes in 34:1 DAG response to 50% variations in (A) the rate of degradation of pool two 34:1 DAG, kdp2, (B) the rate of activation of pool two 34:1 DAG, kap2, and (C) the rate of degradation of pool one 34:1 DAG, kdp1, from their nominal values of 1.3 × 10⁻³ s−1, 3.74 × 10⁻³ s−1 and 1.73 × 10⁻³ s−1, respectively.
Figure 6
Figure 6
Changes in 34:1 DAG response to 50% variations in (A) the rate of degradation of pool two 34:1 DAG, kdp2, (B) the rate of activation of pool two 34:1 DAG, kap2, and (C) the rate of degradation of pool one 34:1 DAG, kdp1, from their nominal values of 1.3 × 10⁻³ s−1, 3.74 × 10⁻³ s−1 and 1.73 × 10⁻³ s−1, respectively.

References

    1. Alliance for Cellular Signaling website. 2008 URL http://www.signaling-gateway.org/.
    1. Bishop WR, Bell RM. Functions of diacylglycerol in glycerolipid metabolism, signal transduction and cellular transformation. Oncogene Res. 1988;2(3):205–218. - PubMed
    1. Born GV, Kratzer MA. Source and concentration of extracellular adenosine triphosphate during haemostasis in rats, rabbits and man. J. Physiol. 1984;354(1):419–429. - PMC - PubMed
    1. Brinson AE, Harden TK. Differential regulation of the uridine nucleotide-activated P2Y4 and P2Y6 receptors: Ser-333 and Ser-334 in the carboxyl terminus are involved in agonist-dependent phosphorylation desensitization and internalization of the P2Y4 receptor. J. Biol. Chem. 2001;276(15):11939–11948. - PubMed
    1. Callender HL. Ph. D. thesis. Vanderbilt University; 2007. Mathematical modeling of species-specific diacylglycerol dynamics in the RAW 264.7 macrophage following P2Y6 receptor activation by uridine 5’-diphosphate. URL http://etd.library.vanderbilt.edu/ETD-db/available/etd-06212007-223551/

Publication types