. 2010 Feb;9(2):388-402.
doi: 10.1074/mcp.M900432-MCP200. Epub 2009 Nov 2.

Application of proteomic marker ensembles to subcellular organelle identification

Affiliations

Application of proteomic marker ensembles to subcellular organelle identification

Alexander Y Andreyev et al. Mol Cell Proteomics. 2010 Feb.

Abstract

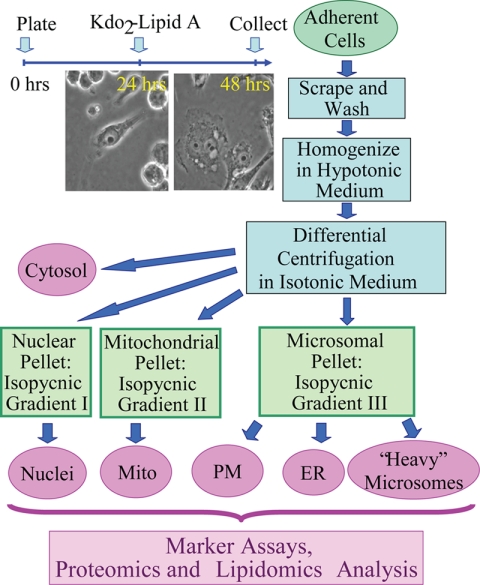
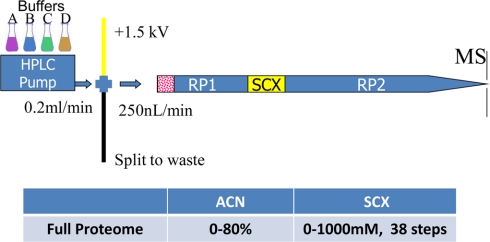
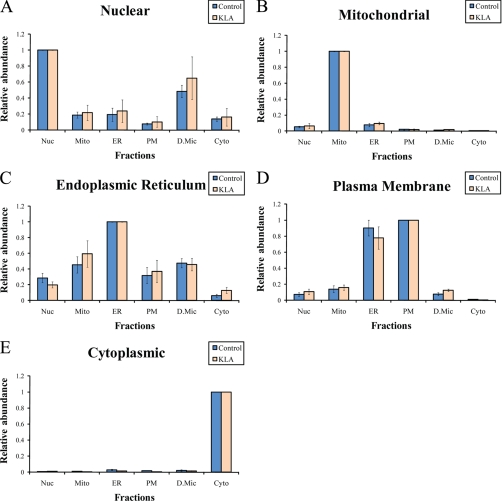
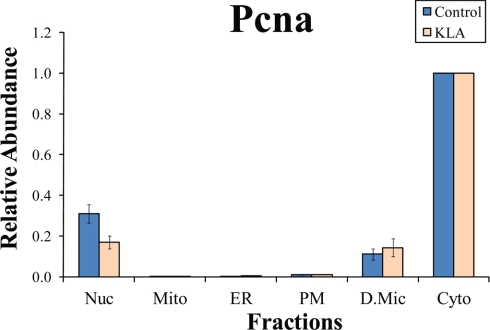
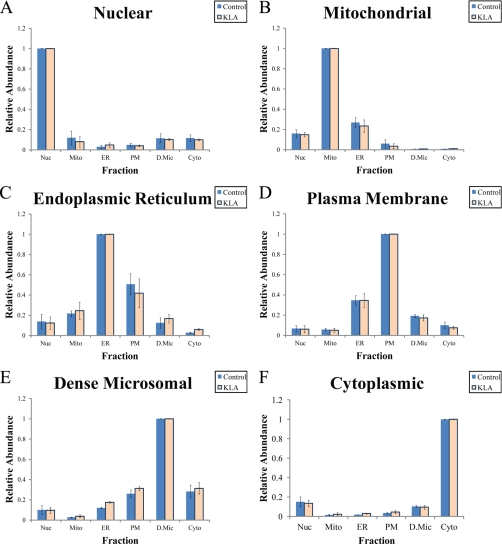
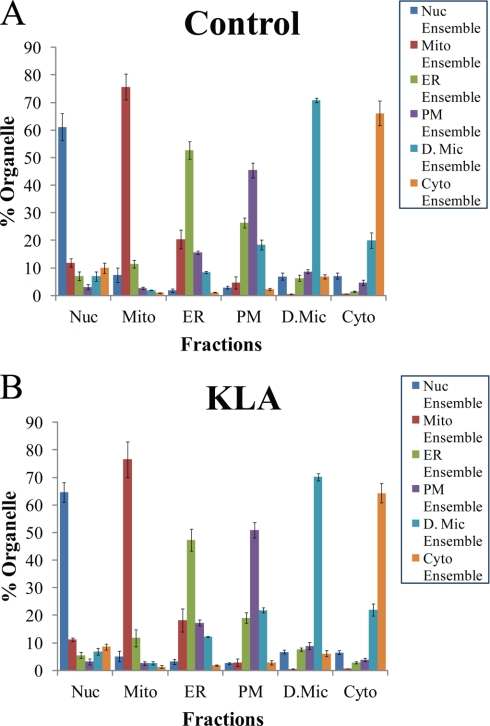
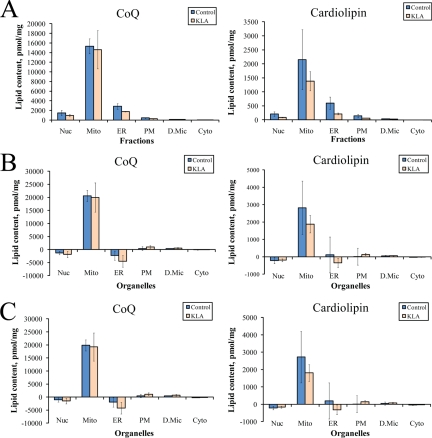
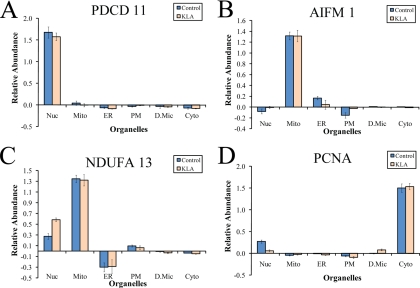
Compartmentalization of biological processes and the associated cellular components is crucial for cell function. Typically, the location of a component is revealed through a co-localization and/or co-purification with an organelle marker. Therefore, the identification of reliable markers is critical for a thorough understanding of cellular function and dysfunction. We fractionated macrophage-like RAW264.7 cells, both in the resting and endotoxin-activated states, into six fractions representing the major organelles/compartments: nuclei, mitochondria, cytoplasm, endoplasmic reticulum, and plasma membrane as well as an additional dense microsomal fraction. The identity of the first five of these fractions was confirmed via the distribution of conventional enzymatic markers. Through a quantitative liquid chromatography/mass spectrometry-based proteomics analysis of the fractions, we identified 50-member ensembles of marker proteins ("marker ensembles") specific for each of the corresponding organelles/compartments. Our analysis attributed 206 of the 250 marker proteins ( approximately 82%) to organelles that are consistent with the location annotations in the public domain (obtained using DAVID 2008, EntrezGene, Swiss-Prot, and references therein). Moreover, we were able to correct locations for a subset of the remaining proteins, thus proving the superior power of analysis using multiple organelles as compared with an analysis using one specific organelle. The marker ensembles were used to calculate the organelle composition of the six above mentioned subcellular fractions. Knowledge of the precise composition of these fractions can be used to calculate the levels of metabolites in the pure organelles. As a proof of principle, we applied these calculations to known mitochondria-specific lipids (cardiolipins and ubiquinones) and demonstrated their exclusive mitochondrial location. We speculate that the organelle-specific protein ensembles may be used to systematically redefine originally morphologically defined organelles as biochemical entities.


Figures

Fig. 1.
Fig. 1.
Subcellular fractionation. The cell treatment timeline is shown in the top left. Upon treatment with Kdo2-lipid A, a cell transition from round or bipolar (at 24 h) to an extremely spread morphology (at 48 h), a hallmark of activation, occurs. At 48 h, the cells were harvested and fractionated; an outline of the fractionation procedure is shown on the right (see text for further detail). The six resulting fractions (shown in purple ovals) were all subjected to the same panel of analytical assays (listed on the bottom). Mito, mitochondria; PM, plasma membrane.
Fig. 2.
Fig. 2.
Schematics of three-phase on-line multidimensional nano-LC system. Peptides are loaded directly onto RP1 and subject to multiple step SCX fractionation followed by high resolution separation on the analytical column (RP2). Typically, it takes 4 days for each full proteome analysis.
Fig. 3.
Fig. 3.
Distribution of conventional markers between fractions (A–E). Intensities of the markers were calculated on a per protein basis followed by normalization to the main fraction. Nuc, nuclei; Mito, mitochondria; PM, plasma membrane; D.Mic, dense microsomes; Cyto, cytosol; KLA, Kdo2-lipid A-activated cells. The data are mean ± S.E.; n = 6.
Fig. 4.
Fig. 4.
Subcellular distribution of PCNA. The y axis shows abundances of PCNA in various fractions relative to the abundance in the main (in this case, nuclear) fraction. Nuc, nuclei; Mito, mitochondria; PM, plasma membrane; D.Mic, dense microsomes; Cyto, cytosol; KLA, Kdo2-lipid A-activated cells. Note the high prevalence of the cytoplasmic, as opposed to reported nuclear, location of PCNA. The data are mean +/- S.E. for three independent preparations.
Fig. 5.
Fig. 5.
Distribution of marker ensembles between fractions (A–F). Nuc, nuclei; Mito, mitochondria; PM, plasma membrane; D.Mic, dense microsomes; Cyto, cytosol; KLA, Kdo2-lipid A-activated cells. Distributions of ensembles are averages of all 50 markers for each organelle. The data are mean ± S.E. for three independent preparations.
Fig. 6.
Fig. 6.
Fraction composition based on proteomic markers (A and B). The percentage of different organelles in each fraction was calculated from the distribution of the organelle-specific marker ensembles among the fractions (see “Results” for details). Nuc, nuclei; Mito, mitochondria; PM, plasma membrane; D.Mic, dense microsomes; Cyto, cytosol; KLA, Kdo2-lipid A-activated cells. The data are mean ± S.E. for three independent preparations.
Fig. 7.
Fig. 7.
Distribution of lipid markers between subcellular organelles. A, measured levels of mitochondrial lipids in the subcellular fractions. The lipid content for all fractions is the sum total of all detected species of each subclass. B, calculated levels of mitochondrial lipids in pure organelles based on marker ensembles. C, calculated levels of mitochondrial lipids in pure organelles based on the six-marker panel (Table III). See text for detail on calculations. Nuc, nuclei; Mito, mitochondria; PM, plasma membrane; D.Mic, dense microsomes; Cyto, cytosol; Cardiolipin, total cardiolipin; CoQ, total coenzyme Q; KLA, Kdo2-lipid A-activated cells. The data are mean ± S.E. for three independent preparations.
Fig. 8.
Fig. 8.
Distribution of selected protein markers among pure organelles (A–D). Protein content in pure organelles was calculated based on the organellar composition of fractions (Fig. 4) and protein distribution in fractions (measured in the iTRAQ experiment). See text for detail on calculations. Nuc, nuclei; Mito, mitochondria; PM, plasma membrane; D.Mic, dense microsomes; Cyto, cytosol; KLA, Kdo2-lipid A-activated cells. The data are mean ± S.E. for three independent preparations.

References

    1. Andersen J. S., Mann M. ( 2006) Organellar proteomics: turning inventories into insights. EMBO Rep 7, 874– 879 - PMC - PubMed
    1. Yates J. R., 3rd, Gilchrist A., Howell K. E., Bergeron J. J. ( 2005) Proteomics of organelles and large cellular structures. Nat. Rev. Mol. Cell Biol 6, 702– 714 - PubMed
    1. Forner F., Foster L. J., Campanaro S., Valle G., Mann M. ( 2006) Quantitative proteomic comparison of rat mitochondria from muscle, heart, and liver. Mol. Cell. Proteomics 5, 608– 619 - PubMed
    1. Andersen J. S., Wilkinson C. J., Mayor T., Mortensen P., Nigg E. A., Mann M. ( 2003) Proteomic characterization of the human centrosome by protein correlation profiling. Nature 426, 570– 574 - PubMed
    1. Dunkley T. P., Watson R., Griffin J. L., Dupree P., Lilley K. S. ( 2004) Localization of organelle proteins by isotope tagging (LOPIT). Mol. Cell. Proteomics 3, 1128– 1134 - PubMed

Publication types