. 2009 Nov 1;23(21):2484-9.
doi: 10.1101/gad.1837309.

SetDB1 contributes to repression of genes encoding developmental regulators and maintenance of ES cell state

Affiliations

SetDB1 contributes to repression of genes encoding developmental regulators and maintenance of ES cell state

Steve Bilodeau et al. Genes Dev. .

Abstract

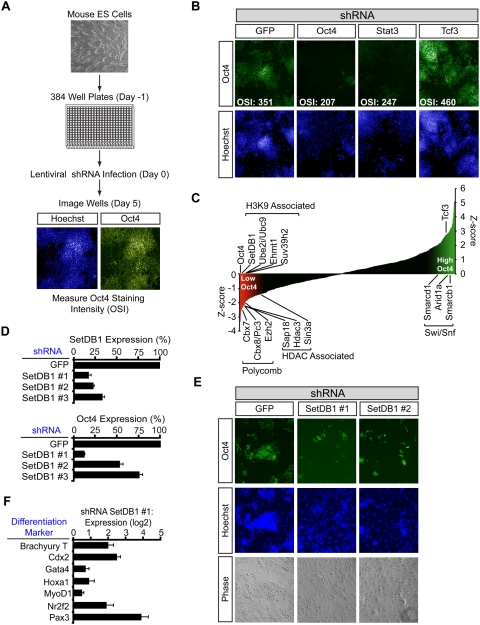
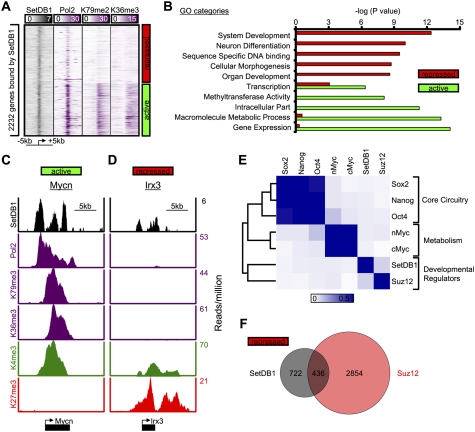
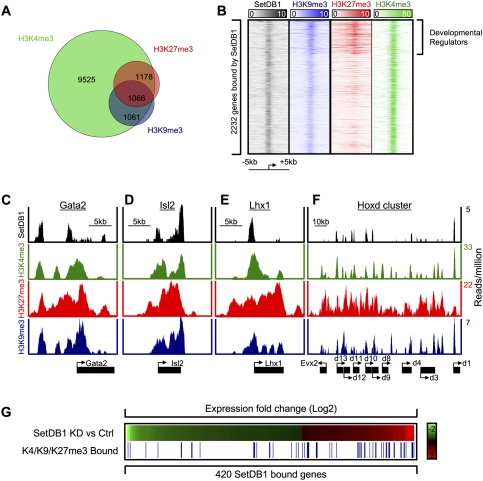
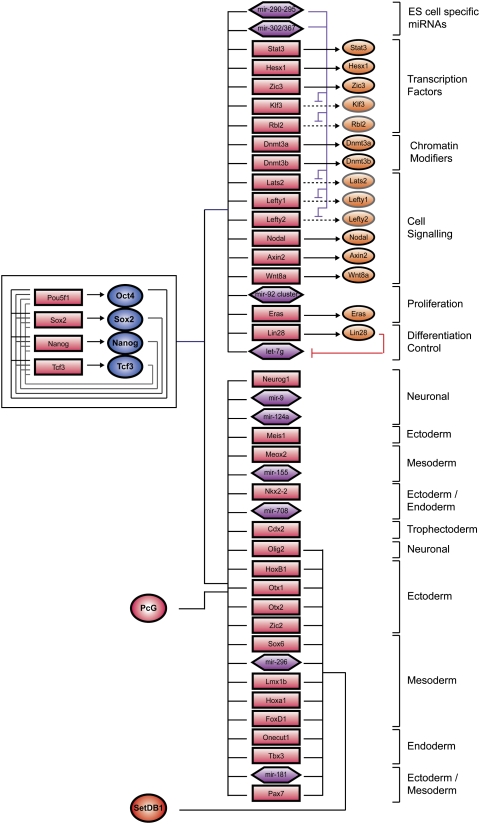
Transcription factors that play key roles in regulating embryonic stem (ES) cell state have been identified, but the chromatin regulators that help maintain ES cells are less well understood. A high-throughput shRNA screen was used to identify novel chromatin regulators that influence ES cell state. Loss of histone H3 Lys 9 (H3K9) methyltransferases, particularly SetDB1, had the most profound effects on ES cells. Chromatin immunoprecipitation (ChIP) coupled with massively parallel DNA sequencing (ChIP-Seq) and functional analysis revealed that SetDB1 and histone H3K9-methylated nucleosomes occupy and repress genes encoding developmental regulators. These SetDB1-occupied genes are a subset of the "bivalent" genes, which contain nucleosomes with H3K4me3 (H3K4 trimethylation) and H3K27me3 modifications catalyzed by Trithorax and Polycomb group proteins, respectively. These genes are subjected to repression by both Polycomb group proteins and SetDB1, and loss of either regulator can destabilize ES cell state.


Figures

Figure 1.
Figure 1.
Identification of chromatin regulators of ES cell state. (A) Outline of the screening protocol. mES cells were seeded without a mouse embryonic fibroblast (MEF) feeder layer into 384-well plates. The following day, wells were infected with individual lentiviral shRNAs targeting chromatin regulators. Infections were done in quadruplicate on separate plates. Five days post-infection, cells were fixed and stained with Hoechst and for Oct4. Cells were identified based on the Hoechst staining, and the average Oct4 staining intensity was quantified using Cellomics software. (B) Representative images from control wells on a 384-well plate. (OSI) Average Oct4 staining intensity of the cells in the well. (C) Selected genes whose shRNAs have large effects on Oct4 staining intensity. Z-scores for Oct4 staining intensity were calculated as described in the Supplemental Material. (D) Validation with multiple SetDB1 shRNAs. mES cells were infected with the indicated shRNA, and Oct4 expression level and SetDB1 knockdown efficiency were evaluated by real-time quantitative PCR (qPCR). (E) SetDB1 knockdown causes reduced Oct4 protein levels and changes in colony morphology. mES cells were infected with the indicated shRNA and stained with Hoechst and for Oct4. (F) SetDB1 knockdown causes up-regulation of differentiation markers. mES cells were infected with SetDB1 shRNA #1, and the expression level of the indicated differentiation marker relative to a shRNA GFP control infection was quantified by real-time qPCR.
Figure 2.
Figure 2.
SetDB1 occupies genes encoding developmental regulators in mES cells. (A) Binding density of regions surrounding the transcriptional start site (±5 kb) of 2232 genes bound by SetDB1. Genes were classified as active if they were enriched for RNA polymerase II, H3K79me2, and H3K36me3, and repressed if they lacked such evidence. (B) Gene Ontology (GO) analysis of genes occupied by SetDB1 that were categorized as active or repressed in mES cells. (C,D) SetDB1, RNA polymerase II, and histone H3K79me2, H3K36me3, H3K4me3, and H3K27me3 modification profiles for an actively transcribed gene (Mycn), an oncogene, and a repressed gene (Irx3), a homeodomain-containing transcription factor that is involved in spatially prepatterning the neural system. (E) Heat map showing colocalization frequency of SetDB1 and PRC subunit Suz12, together with other key ES cell transcriptional regulators. Colors in the heat map reflect the colocalization frequency of each pair of regulators (blue means more frequently colocalized). Regulators were clustered along both axes based on the similarity in their colocalization with other regulators. (F) Venn diagram representation of repressed genes occupied by SetDB1 and Suz12.
Figure 3.
Figure 3.
Genes encoding developmental regulators are often occupied by SetDB1 and at least three histone modifications. (A) Venn diagram representation of genes occupied by nucleosomes modified with histone H3K4me3, H3K27me3, and H3K9me3. Approximately half of the genes that are occupied by both H3K4me3 and H3K27me3 are also occupied by H3K9me3. (B) Histone modifications in promoter-proximal regions of 2232 genes bound by SetDB1 surrounding the transcriptional start site (±5 kb). A set of developmental regulator genes are enriched for SetDB1 binding and nucleosomes containing H3K9me3, H3K27me3, and H3K4me3. (C–F) SetDB1 and histone H3K4me3, H3K27me3, and H3K9me3 occupancy profiles for Gata2, Isl2, Lhx1, and the Hoxd cluster. (G) Expression profiles showing changes in gene expression in SetDB1 knockdown cells relative to control shRNA cells. Red and green represent Log2 transformed probe signal levels. Genes occupied by histone H3K9me3, H3K27me3, and H3K4me3 are shown as blue lines. Genes up-regulated upon SetDB1 knockdown were 3.6-fold enriched (P < 10−14) for H3K4me3/H3K27me3/H3K9me3 occupancy (32 out of 164), while down-regulated genes were not enriched (16 out of 256).
Figure 4.
Figure 4.
Model for transcriptional regulation by SetDB1. A model of core ES cell regulatory circuitry is shown with a subset of genes occupied by the transcription factors and chromatin regulators depicted in the diagram. The interconnected autoregulatory loop is shown to the left. Active genes are shown at the top right, and inactive genes are shown at the bottom right. Transcription factors are represented by dark-blue circles, and PcG complexes and SetDB1 are indicated by a red circle. Gene promoters are represented by red rectangles, gene products are indicated by orange circles, and miRNA promoters are represented by purple hexagons.

References

    1. Ayyanathan K, Lechner MS, Bell P, Maul GG, Schultz DC, Yamada Y, Tanaka K, Torigoe K, Rauscher FJ., III Regulated recruitment of HP1 to a euchromatic gene induces mitotically heritable, epigenetic gene silencing: A mammalian cell culture model of gene variegation. Genes & Dev. 2003;17:1855–1869. - PMC - PubMed
    1. Azuara V, Perry P, Sauer S, Spivakov M, Jorgensen HF, John RM, Gouti M, Casanova M, Warnes G, Merkenschlager M, et al. Chromatin signatures of pluripotent cell lines. Nat Cell Biol. 2006;8:532–538. - PubMed
    1. Bernstein BE, Mikkelsen TS, Xie X, Kamal M, Huebert DJ, Cuff J, Fry B, Meissner A, Wernig M, Plath K, et al. A bivalent chromatin structure marks key developmental genes in embryonic stem cells. Cell. 2006;125:315–326. - PubMed
    1. Boyer LA, Lee TI, Cole MF, Johnstone SE, Levine SS, Zucker JP, Guenther MG, Kumar RM, Murray HL, Jenner RG, et al. Core transcriptional regulatory circuitry in human embryonic stem cells. Cell. 2005;122:947–956. - PMC - PubMed
    1. Boyer LA, Plath K, Zeitlinger J, Brambrink T, Medeiros LA, Lee TI, Levine SS, Wernig M, Tajonar A, Ray MK, et al. Polycomb complexes repress developmental regulators in murine embryonic stem cells. Nature. 2006;441:349–353. - PubMed

Publication types

MeSH terms

Associated data