. 2008 Jul;2(4):645-57.
doi: 10.1177/193229680800200416.

Autonomic mechanisms and therapeutic implications of postural diabetic cardiovascular abnormalities

Affiliations

Autonomic mechanisms and therapeutic implications of postural diabetic cardiovascular abnormalities

Rohit R Arora et al. J Diabetes Sci Technol. 2008 Jul.

Abstract

Background: Cardiovascular autonomic neuropathy (CAN) is a disorder of progressive autonomic dysfunction (AD) associated with diabetes and other chronic diseases. Orthostatic hypotension (OH) is one of the most incapacitating symptoms of CAN and AD. AD in OH can include sympathetic withdrawal (SW). To detect and diagnose SW, parasympathetic and sympathetic changes must be clearly differentiated from each other. This is accomplished by means of the novel autonomic nervous system (ANS) method based on the simultaneous spectral analyses of respiratory activity (RA) and heart rate variability (HRV).

Methods: We performed autonomic profiling of 184 (142 females) consecutive, arrhythmia-free patients with type 2 diabetes using the ANX-3.0 autonomic monitoring system. The patient cohort included 86 (64 female) patients for whom an alpha(1)-agonist was the only drug changed and increased from one test to the next; 37 (33 female) for whom the alpha(1)-agonist was discontinued; and 61 (45 female) who were on an alpha(1)-agonist, but for whom no drug changes were made. The tests averaged 3.1 +/- 1.4 months apart; midodrine (ProAmatine) was the alpha(1)-agonist prescribed. Of the group, 99 patients also had hypertension and 47 also had cardiovascular disease. No patient had supine hypertension.

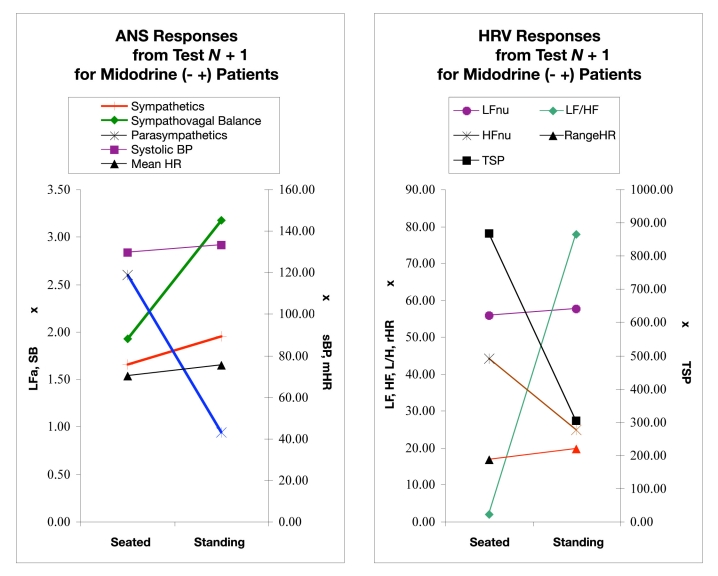
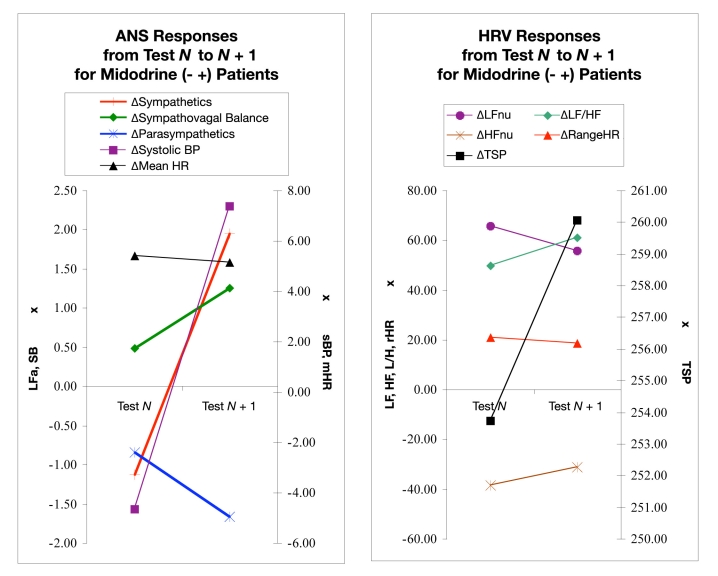
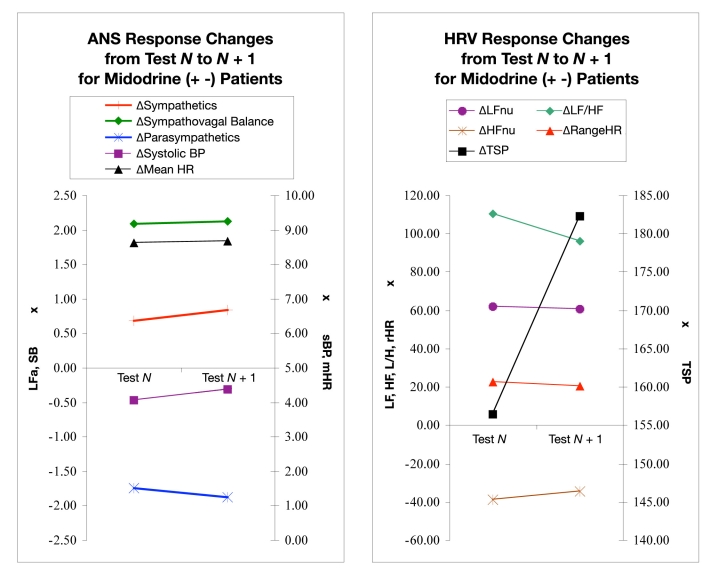
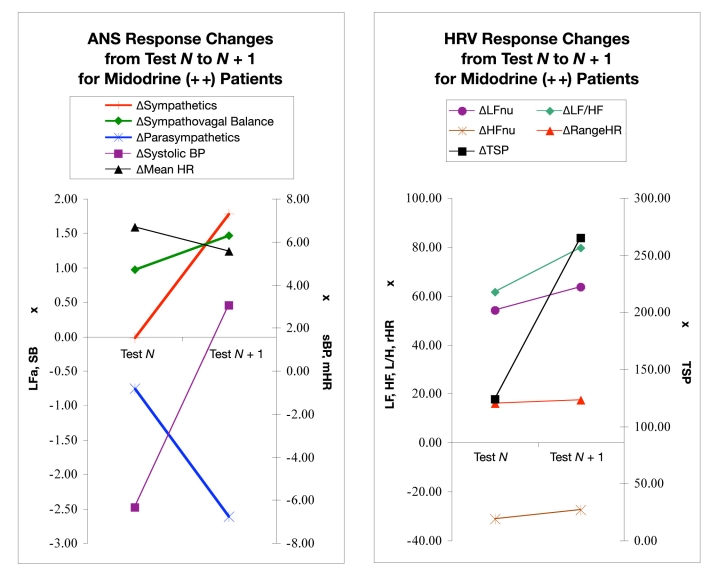
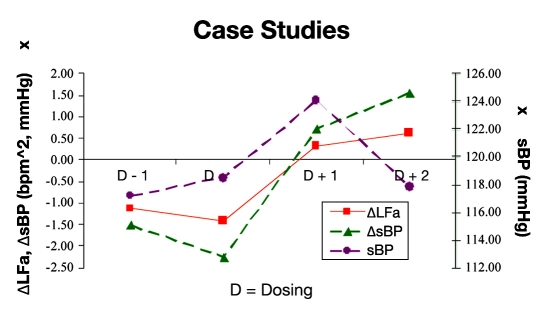
Results: Changes in parameters from the HRV (without respiration) and ANS methods were compared with changes in heart rate and blood pressure (BP) as measured from one test (test N) to the next (test N + 1). SW with a BP drop of less than the clinical definition may be a trend that can be an early indicator of orthostasis. In this study, patients were treated with low-dose, short-term alpha(1)-agonist (vasopressor) therapy, which tended to correct the abnormal trend of SW with a drop in BP. Included in the findings was a systolic BP trend in response to vasopressor therapy of an (expected) initial increase in BP followed by an eventual decrease in systolic BP as SW was reversed.

Conclusions: The ANS method enables quantitative assessment of CAN by independently and simultaneously quantifying the two branches of the ANS, sympathetic and parasympathetic. The ANS method modifies standard spectral analysis of HRV (without RA analysis) by incorporating spectral analysis of RA. The ANS method appears to model the normal and abnormal responses to upright posture and changes in vasopressor therapy with greater fidelity than the HRV method. Independent, simultaneous assessment of progressive parasympathetic and sympathetic dysfunction, autonomic imbalance, and responses of the two ANS branches to therapy seems to enable early detection and early intervention. Orthostasis, by way of example, illustrates that frequent, sensitive assessments of both ANS branches can improve the negative outcomes associated with CAN.

Keywords: autonomic nervous system; cardiovascular autonomic neuropathy; orthostatic hypotension; postural orthostatic tachycardia syndrome; respiratory activity analysis; vasopressor.


Figures

Figure 1
Figure 1
Average ANS (left) and HRV (right) responses from 5-minutes seated to a quick stand followed by 5 minutes of standing from the predosing test (test N). (Left) Sympathetic (LFa) and parasympathetic (RFa) measures, sympathovagal balance (SB = LFa/RFa), systolic BP, and mean HR. (Right) Normalized low- and high-frequency parameters (LFnu and HFnu, respectively), total spectral power (TSP), and range HR. Data represent results from patients presenting with orthostatic symptoms as evidenced by the average decrease in systolic BP (P < 0.0010). Midodrine was introduced following this test in this subpopulation of patients. See text for details.
Figure 2
Figure 2
ANS (left) and HRV (right) responses from 5 minutes seated to a quick stand followed by 5 minutes of standing during a follow-up test (test N + 1), approximately 3 months postdosing. (Left) Sympathetic (LFa) and parasympathetic (RFa) measures, sympathovagal balance (SB = LFa/RFa), systolic BP, and mean HR. (Right) Normalized low- and high-frequency parameters (LFnu and HFnu, respectively), total spectral power (TSP), and range HR. These data are from patients first presenting with orthostatic symptoms and for whom midodrine was introduced and are reporting significantly fewer orthostatic symptoms, as evidenced by the change from an average decrease in systolic BP during the first test (Figure 1) to an average increase in systolic BP presented in this figure (P < 0.0010). See text for details.
Figure 3
Figure 3
ANS (left) and HRV (right) responses from predosing (test N) to postdosing (test N + 1), where midodrine was introduced immediately after test N. Each data point represents a parameter response to a 5-minute seated to a 5-minute standing postural change. Each pair of points shows the change in the postural response from a pair of consecutive tests, “test N” to a follow-up “test N + 1” where midodrine was introduced immediately after test N. Test N + 1 is approximately 3 months after dosing. (Left) Sympathetic (LFa) and parasympathetic (RFa) measures, sympathovagal balance (SB = LFa/RFa), systolic BP, and mean HR. (Right) Normalized low- and high-frequency parameters (LFnu and HFnu, respectively), total spectral power (TSP), and range HR. See text for details.
Figure 4
Figure 4
ANS (left) and HRV (right) responses from test N to test N + 1, where midodrine was introduced prior to test N and discontinued before test N + 1. Each data point represents a parameter response to a 5-minute seated to a 5-minute standing postural change. Each pair of points shows the change in the postural response from a pair of consecutive tests, “test N” to a follow-up “test N + 1” where midodrine was discontinued immediately after test N. Test N + 1 is approximately 3 months later. (Left) Sympathetic (LFa) and parasympathetic (RFa) measures, sympathovagal balance (SB = LFa/RFa), systolic BP, and mean HR. (Right) Normalized low- and high-frequency parameters (LFnu and HFnu, respectively), total spectral power (TSP), and range HR. See text for details.
Figure 5
Figure 5
ANS (left) and HRV (right) responses from test N to test N + 1, where midodrine was introduced prior to test N and the patient continued to have it on board through test N + 1. Each data point represents a parameter response to a 5-minute seated to a 5-minute standing postural change. Each pair of points shows the change in the postural response from a pair of consecutive tests, “test N” to a follow-up “test N + 1.” Test N + 1 is approximately 3 months later. (Left) Sympathetic (LFa) and parasympathetic (RFa) measures, sympathovagal balance (SB = LFa/RFa), systolic BP, and mean HR. (Right) Normalized low- and high-frequency parameters (LFnu and HFnu, respectively), total spectral power (TSP), and range HR. See text for details.
Figure 6
Figure 6
Changes in response to postural change from predosing to postdosing (D − 1 to D + 1) in the sympathetic measure (ΔLFa, solid line with squares) and systolic BP (ΔsBP, broken line with triangles). Also shown is the resting systolic BP (broken line with filled asterisks; the scale is on the right). These are averages from 22 of the patients from the cohort who had more than four serial tests. The test series are centered on the test just prior to which midodrine was introduced (designated on the abscissa as “D”). See text for details.

References

    1. Vinik AI, Freeman R, Erbas T. Diabetic autonomic neuropathy. Semin Neurol. 2003;23(4):365–372. - PubMed
    1. Vinik AI, Aysin B, Colombo J. Diabetes Technology Conference. San Francisco: CA; 2005. Dynamic enhanced frequency domain analysis indicates a significant decline in autonomic function before age 50. Nov 10–12.
    1. Vinik AI, Aysin B, Colombo J. Diabetes Technology Conference. San Francisco: CA; 2005. Differentiation of autonomic dysfunction by enhanced frequency domain analysis reveals additional stages in the progression of autonomic decline in diabetics. Nov 10–12.
    1. Freeman R. Assessment of cardiovascular autonomic function. Clin Neurophysiol. 2006;117(4):716–730. - PubMed
    1. Vinik AI, Freeman R, Erbas T. Diabetic autonomic neuropathy. Semin Neurol. 2003;23(4):365–372. - PubMed