. 2009 Dec;19(12):2172-84.
doi: 10.1101/gr.098921.109. Epub 2009 Nov 3.

Erythroid GATA1 function revealed by genome-wide analysis of transcription factor occupancy, histone modifications, and mRNA expression

Affiliations

Erythroid GATA1 function revealed by genome-wide analysis of transcription factor occupancy, histone modifications, and mRNA expression

Yong Cheng et al. Genome Res. 2009 Dec.

Abstract

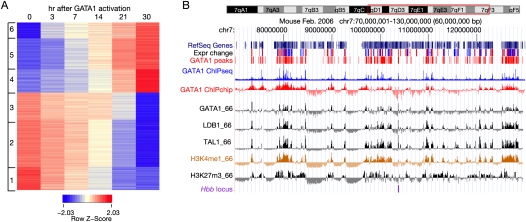
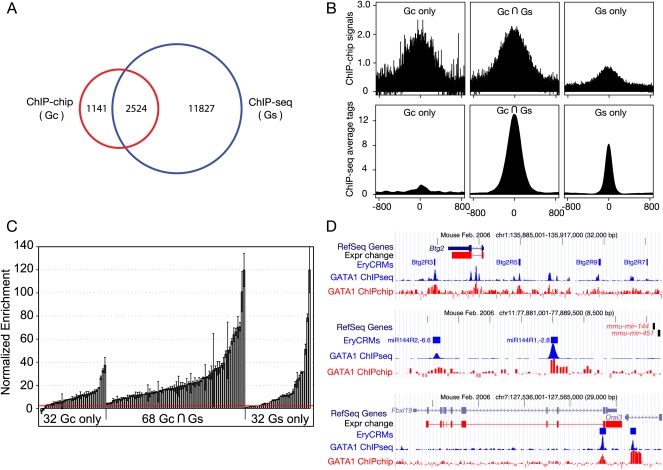
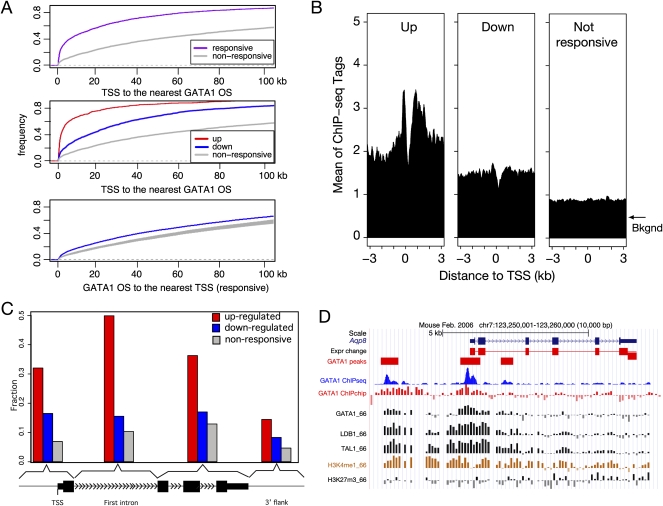
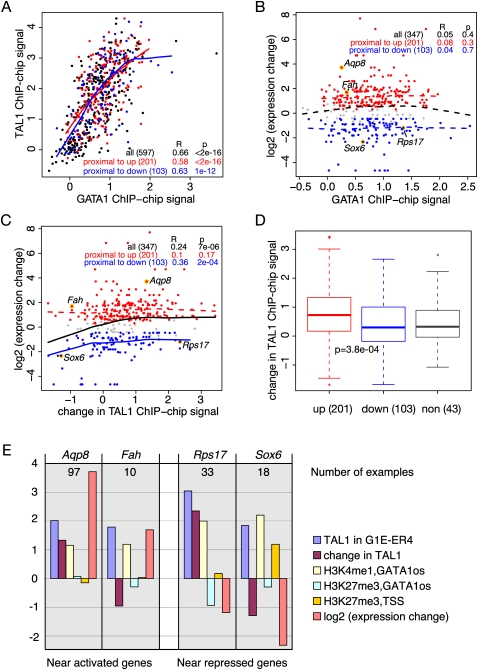
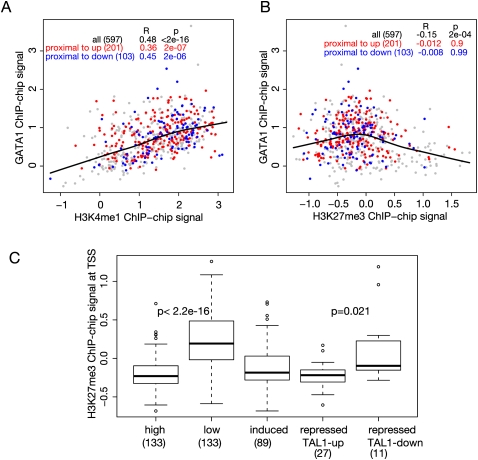
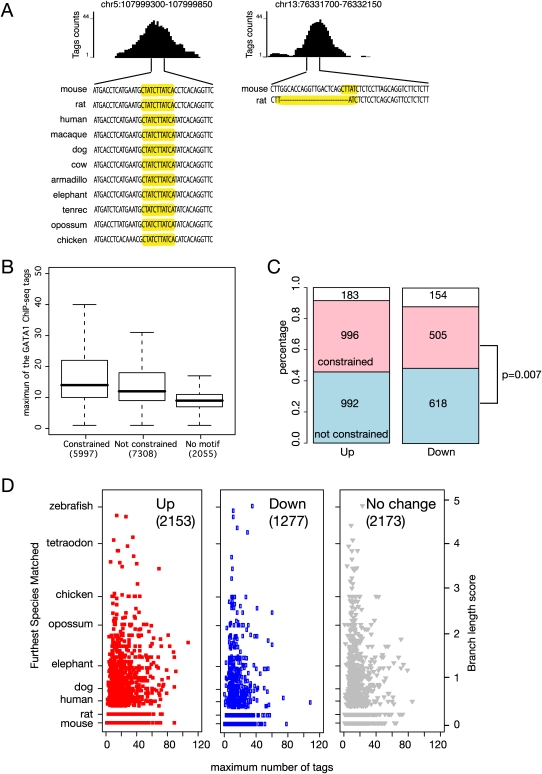
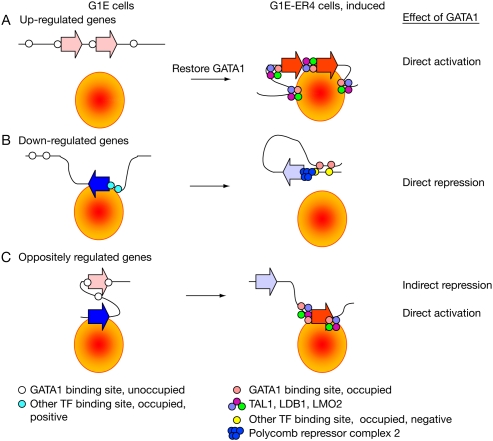
The transcription factor GATA1 regulates an extensive program of gene activation and repression during erythroid development. However, the associated mechanisms, including the contributions of distal versus proximal cis-regulatory modules, co-occupancy with other transcription factors, and the effects of histone modifications, are poorly understood. We studied these problems genome-wide in a Gata1 knockout erythroblast cell line that undergoes GATA1-dependent terminal maturation, identifying 2616 GATA1-responsive genes and 15,360 GATA1-occupied DNA segments after restoration of GATA1. Virtually all occupied DNA segments have high levels of H3K4 monomethylation and low levels of H3K27me3 around the canonical GATA binding motif, regardless of whether the nearby gene is induced or repressed. Induced genes tend to be bound by GATA1 close to the transcription start site (most frequently in the first intron), have multiple GATA1-occupied segments that are also bound by TAL1, and show evolutionary constraint on the GATA1-binding site motif. In contrast, repressed genes are further away from GATA1-occupied segments, and a subset shows reduced TAL1 occupancy and increased H3K27me3 at the transcription start site. Our data expand the repertoire of GATA1 action in erythropoiesis by defining a new cohort of target genes and determining the spatial distribution of cis-regulatory modules throughout the genome. In addition, we begin to establish functional criteria and mechanisms that distinguish GATA1 activation from repression at specific target genes. More broadly, these studies illustrate how a "master regulator" transcription factor coordinates tissue differentiation through a panoply of DNA and protein interactions.


Figures

Figure 1.
Figure 1.
Gene expression response and chromosomal DNA occupancy after restoring GATA1 in erythroid cells. (A) The expression patterns of GATA1 responsive genes are portrayed as a heat map, with red indicating higher levels and blue indicating lower levels of expression for each gene. Each row represents the expression level of one gene at the time points after induction indicated for each column. The hybridization signals from three replicates at each time point were averaged, and the log (base 2) of the average signals were normalized in each row to generate a Z-score. The data matrix was clustered using the k-means method with k = 6; the results show three clusters of up-regulated genes and three clusters of down-regulated genes (indicated on the left). (B) Large-scale view of expression response, occupancy by transcription factors, and repressive histone modification in erythroid cells. For a 60-Mb region of mouse chromosome 7 centered on the Hbb gene complex (outlined in red on the ideogram at the top), the tracks of data show (in order) RefSeq genes, indicators of the change in expression level (red for up- and blue for down-regulation) in response to restoration of GATA1, the genome-wide GATA1 peak calls, the ChIP-seq data for GATA1 after peak calling by MACS (blue), the raw ChIP-chip hybridization signals for GATA1 (tracks labeled GATA1_HD2 for the genome-wide data and GATA1_66 for chromosome 7 data), TAL1 and LDB1 occupancy, the raw ChIP-chip hybridization data for monomethylation of H3K4 and trimethylation of H3K27, and the location of the Hbb locus (purple). (Expr change) Change in expression level; (GATA1 peaks) those deduced from the genome-wide ChIP-chip data. The image was generated on a customized installation of the UCSC Genome Browser (Kent et al. 2002).
Figure 2.
Figure 2.
Accuracy of GATA1 peaks from high-throughput analysis of ChIPs. (A) The Venn diagram shows the relationships among peaks called from ChIP-seq and ChIP-chip data on GATA1 in G1E-ER4 cells. (Gc) G1E-ER4 ChIP-chip; (Gs) G1E-ER4 ChIP-seq. (B) Support of raw ChIP-chip and ChIP-seq data for peaks called from different technologies. The graphs show the mean ChIP-chip and ChIP-seq signals for occupancy for common and unique peaks, centered on the middle of the called peak and extending 800 bp on each side. (C) Validation of GATA1 peaks by quantitative PCR. From the peaks called for the genome-wide GATA1 ChIP data, 68 from the set common to ChIP-seq and ChIP-chip peaks, 32 from the ChIP-chip only peaks, and 32 from the ChIP-seq only peaks were chosen randomly for validation of occupancy by GATA1 using a qPCR assay, along with 20 negative control regions (not called as peaks). The bar-plot shows the mean of two determinations of the enrichment for each tested DNA segment in the GATA1 ChIP material (error bars cover the range), expressed as the number of standard deviations above the normalized mean of the negative controls (see Supplemental material). The red line indicates the threshold for validation (two standard deviations above the mean of the negative controls). (D) Data for previously studied genes, showing strong correspondence between validated erythroid CRMs and the new ChIP-seq and ChIP-chip data for GATA1. Data tracks show genes, expression response, positions of experimentally validated cis-regulatory modules, and ChIP-seq and ChIP-chip data for GATA1.
Figure 3.
Figure 3.
Proximity of induced genes to GATA1-occupied DNA segments. (A) The cumulative distribution of the distance from the TSS of each gene in a response category to the nearest GATA1-occupied DNA segment (GATA1 OS) is shown in each panel, with the y-axis showing the fraction of genes whose nearest GATA1 OS is within the designated distance. The color of each distribution line is distinctive for each response category (purple for all responsive genes, red for up-regulated, blue for down-regulated, and gray for nonresponsive genes). The distributions of distances from the GATA1 OSs to the TSS of responsive genes are shown in the bottom panel, with the gray lines for 1000 iterations of random selection of TSSs from 2616 nonresponsive genes. (B) GATA1 occupancy signals near the TSSs. The distribution of raw GATA1 ChIP-seq signals (mean number of ChIP-seq tags in 100-bp windows) is graphed as a function of distance on either side of the TSS of genes in three response categories. DNA upstream of the TSS is given a negative value for the distance from the TSS. All the genes in a designated category were first centered by the TSS and then windows were extended along each side of TSS up to 3 kb. (C) Preferred locations of GATA1-occupied segments with respect to genes. The bar graph presents the fraction of genes in each response category that has at least one GATA1 OS in the indicated subregion of a gene. These subregions are segments around the TSS (−5 kb from the TSS to the end of the first exon), the first intron, the remaining exons and introns, and 5 kb past the poly(A) addition site. (D) An example of newly discovered GATA1 OSs close to the TSS of the GATA1-incuded gene Aqp8. Tracks are as in Fig. 1B.
Figure 4.
Figure 4.
Correlation among GATA1, TAL1, and changes in gene expression. (A) Scatterplot for the level of occupancy by GATA1 (x-axis) and TAL1 (y-axis) for all GATA1 OSs in the 66-Mb region of mouse chromosome 7, with the GATA1 OSs in the proximal neighborhood of up-regulated genes shown as red dots (increase in expression above the FDR threshold of 0.001), those in the proximal neighborhood of down-regulated genes shown as blue dots (decrease in expression exceeding the FDR threshold of 0.001), and all others as black dots. The ChIP-chip hybridization levels for the several probes in each interval covering a GATA1 OS were averaged and used as a proxy for occupancy for GATA1 and TAL1. The Pearson's correlation coefficient R and P-value are listed for three categories of GATA1 OS (all, and those in the proximal neighborhoods of up- or down-regulated genes), and the lowess line is drawn separately for each category of GATA1 OSs. The lowess lines for nonsignificant associations are broken whereas those for significant associations are solid. (B,C) Scatterplots for the relationship between the change in expression level for the genes in whose proximal neighborhood a GATA1 OS is found (y-axis) and GATA1 occupancy (x-axis in B) or the change in TAL1 occupancy between G1E-ER4 cells (GATA1 restored and activated) and G1E Gata1 knockout cells (x-axis in C). The largest difference in expression level (compared with that at time 0) at any point in the time course after activation is the expression change. (D) Boxplots of the distributions of values for the change in TAL1 occupancy in GATA1 OSs associated with genes in three expression categories (non, nonresponsive; up, induced; down, repressed). The differences between the up- and down-regulated categories are significant by a Student's t-test (P = 3.3 × 10⁻⁵). (E) Examples illustrating the range of features observed at GATA1 OSs in the neighborhoods of two induced genes and two repressed genes (right). The bars are the mean ChIP-chip signals for the probes in the interval for each GATA1 OS (see key) or the log (base 2) of the expression change. The number of GATA1 OSs that fit the pattern shown is given in each graph (see Table 1).
Figure 5.
Figure 5.
Correlations of histone modifications with occupancy and transcriptional status. (A,B) Scatterplots showing the correlation of GATA1 occupancy (proxied by mean ChIP-chip signal on the y-axis) with the levels of monomethylation of histone H3K4 (H3K4me1, x-axis in A) or with levels of trimethylation of histone H3K27 (H3K27me3, x-axis in B) in each GATA1 OS. The histone modifications were determined in G1E-ER4 cells treated with estradiol. Colors of the dots for GATA1 OSs are red for those associated with up-regulated genes, blue for those associated with down-regulated genes, and gray for all other GATA1 OSs in the 66-Mb region of chromosome 7. The lowess line is for all the data points, and correlations for the different expression categories are given in the inset table in each graph. (C) Boxplot comparing the distributions of H3K27me3 around the TSS of genes in the indicated expression categories. The mean levels of the histone modification around the TSS for each gene in a category were computed. The distributions are significantly different when comparing the high (top quartile of expression levels from the transcriptome analysis) versus low expressed genes (bottom quartile) (P < 2.2 ×10⁻¹⁶) and repressed genes distinguished by co-occupancy between GATA1 and TAL1 (TAL1-down vs. TAL1-up, P = 0.021), using a single-tailed t-test. The numbers of genes in each category are given in parentheses.
Figure 6.
Figure 6.
Correlation of evolutionary constraint on the WGATAR binding site motif and level of occupancy and induction of target genes. (A) Examples of GATA1 OSs with equal occupancy by GATA1, with deep preservation of the WGATAR motif on the left but a rodent-specific motif on the right. (B) Boxplot comparing the distributions of occupancy level in GATA1 OSs after partitioning them by evidence of purifying selection (constraint) on the binding site motif or absence of the motif. Analyses in this figure use all GATA1 OSs in the proximal neighborhood of genes throughout the mouse genome. (C) Bar graphs presenting the percentages (y-axis) and the numbers (in each box) of GATA1 OSs in the proximal neighborhoods of up-regulated and down-regulated genes, again partitioning them by evidence of constraint (red) or not (blue) on the binding site motif. The numbers of GATA1 OSs with no WGATAR motif are given in the white boxes. The P-value is for a χ2-test on motif constraint and direction of regulation. (D) The ranges of constraint on the most deeply conserved WGATAR binding site motif in each GATA1 OS (expressed on the y-axis as the branch length score from mouse to the most distant species to which the motif is preserved) and of occupancy (expressed as the maximum number of sequence tags in the ChIP-seq data). The results are shown for GATA1 OSs in the proximal neighborhood of up-regulated, down-regulated, and nonresponsive genes. Along the left side, the branch length score is calibrated by the comparison species representing the major clades.
Figure 7.
Figure 7.
Direct activation and direct versus indirect repression of genes. (A) Up-regulation via direct activation. (B) Down-regulation via direct repression. (C) Down-regulation as a consequence of up-regulation. Gene transcription is diagrammed as occurring in a transcription factory (orange disk with red center); genes not in contact with the factory are not expressed. Genes are shown as boxed arrows, with a bright solid fill indicating active transcription and a light fill indicating no transcription (red for induced, blue for repressed genes). Circles along the line (representing the DNA fiber) are transcription factor binding sites. Open circles indicate a lack of occupancy, and solid colors indicate occupancy; the color code is in the key. The situations prior to and subsequent to restoring GATA1 are on the left and right, respectively. Repressor proteins can recruit the Polycomb repressor complex 2 to methylate histone H3K27, but the chromatin structure is not shown explicitly.

References

    1. Anguita E, Hughes J, Heyworth C, Blobel GA, Wood WG, Higgs DR. Globin gene activation during haemopoiesis is driven by protein complexes nucleated by GATA-1 and GATA-2. EMBO J. 2004;23:2841–2852. - PMC - PubMed
    1. Bieda M, Xu X, Singer MA, Green R, Farnham PJ. Unbiased location analysis of E2F1-binding sites suggests a widespread role for E2F1 in the human genome. Genome Res. 2006;16:595–605. - PMC - PubMed
    1. Blobel GA, Weiss MJ. Nuclear factors that regulate erythropoiesis. In: Steinberg MH, et al., editors. Disorders of Hemoglobin: Genetics, Pathophysiology, and Clinical Management. Cambridge University Press; Cambridge, UK: 2001. pp. 72–94.
    1. Cantor A, Orkin S. Transcriptional regulation of erythropoiesis: An affair involving multiple partners. Oncogene. 2002;21:3368–3376. - PubMed
    1. Carroll JS, Meyer CA, Song J, Li W, Geistlinger TR, Eeckhoute J, Brodsky AS, Keeton EK, Fertuck KC, Hall GF, et al. Genome-wide analysis of estrogen receptor binding sites. Nat Genet. 2006;38:1289–1297. - PubMed

Publication types

MeSH terms

Associated data