. 2010 Jan;298(1):E108-16.
doi: 10.1152/ajpendo.00524.2009. Epub 2009 Nov 3.

Calorie restriction increases fatty acid synthesis and whole body fat oxidation rates

Affiliations

Calorie restriction increases fatty acid synthesis and whole body fat oxidation rates

Matthew D Bruss et al. Am J Physiol Endocrinol Metab. 2010 Jan.

Abstract

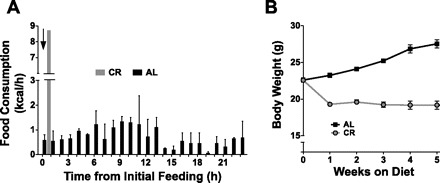
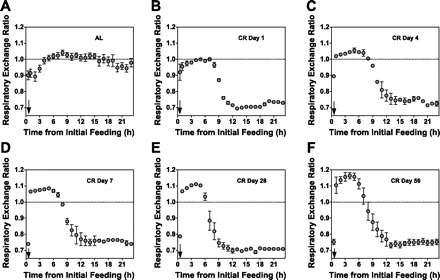
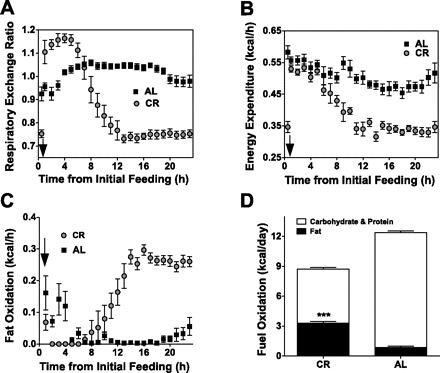
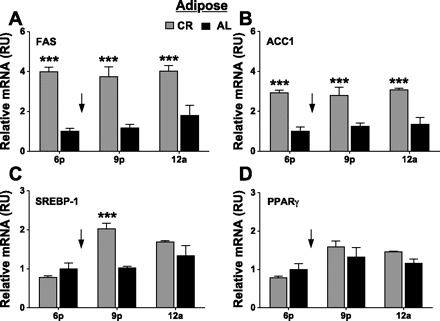
Calorie restriction (CR) increases longevity and retards the development of many chronic diseases, but the underlying metabolic signals are poorly understood. Increased fatty acid (FA) oxidation and reduced FA synthesis have been hypothesized to be important metabolic adaptations to CR. However, at metabolic steady state, FA oxidation must match FA intake plus synthesis; moreover, FA intake is low, not high, during CR. Therefore, it is not clear how FA dynamics are altered during CR. Accordingly, we measured food intake patterns, whole body fuel selection, endogenous FA synthesis, and gene expression in mice on CR. Within 2 days of CR being started, a shift to a cyclic, diurnal pattern of whole body FA metabolism occurred, with an initial phase of elevated endogenous FA synthesis [respiratory exchange ratio (RER) >1.10, lasting 4-6 h after food provision], followed by a prolonged phase of FA oxidation (RER = 0.70, lasting 18-20 h). CR mice oxidized four times as much fat per day as ad libitum (AL)-fed controls (367 +/- 19 vs. 97 +/- 14 mg/day, P < 0.001) despite reduced energy intake from fat. This increase in FA oxidation was balanced by a threefold increase in adipose tissue FA synthesis compared with AL. Expression of FA synthase and acetyl-CoA carboxylase mRNA were increased in adipose and liver in a time-dependent manner. We conclude that CR induces a surprising metabolic pattern characterized by periods of elevated FA synthesis alternating with periods of FA oxidation disproportionate to dietary FA intake. This pattern may have implications for oxidative damage and disease risk.


Figures

Fig. 1.
Fig. 1.
Altered feeding pattern and body weight in response to calorie restriction. Food was provided to calorie-restricted (CR) and ad libitum (AL)-fed mice at 6 PM. A: food consumption was recorded hourly, using food balance in metabolic cages, over the next 24 h. B: mice were weighed weekly. Values are means ± SE for 6 mice/group. ↓Time when daily food was provided to CR mice.
Fig. 2.
Fig. 2.
Time course of effect of calorie restriction on fuel selection pattern. AL-fed mice were placed in metabolic cages before starting a CR diet (A) and again on days 1 (B), 4 (C), 7 (D), 28 (E), and 56 (F) of calorie restriction. Gas exchange was monitored for 24 h each time mice were placed in metabolic cages. Respiratory exchange ratios (RER) were recorded 6 times/h and then averaged to give RER for each hour. Values are means ± SE for 4 mice/diet. ↓Time when daily food was provided to CR mice.
Fig. 3.
Fig. 3.
Higher rates of whole body fat oxidation in response to calorie restriction. Mice were adapted to CR or AL feeding for ≥5 wk and then placed in metabolic cages for 24 h to determine RER (A) and energy expenditure (B) at each hour of the day. Hourly fat oxidation (C) and summed daily macronutrient oxidation (D) were calculated as described in methods. Values are means ± SE (n = 4–8 mice/group). ***P < 0.001, difference from AL values by ANOVA and Bonferroni post hoc test. ↓Time when daily food was provided to CR mice.
Fig. 4.
Fig. 4.
Effect of CR on fatty acid (FA) synthesis in adipose tissue and liver. Daily FA synthesis was calculated for the 4 most abundant FAs: palmitate (16:0), palmitoleate (16:1), stearate (18:0), and oleate (18:1). In the subcutaneous adipose depot (A) and the liver (B) in CR and AL mice, values are expressed as mg/g tissue. C: total adipose and liver FA that was synthesized during the period of 2H2O exposure and remained in the tissue was calculated from values in A and B and adjusted for estimated whole body fat mass (as described in methods) and measured liver weights, respectively. Values are means ± SE (n = 8–14 mice/dietary group). ***P < 0.001, **P < 0.01, *P < 0.05, difference from AL values by ANOVA and Bonferroni post hoc test.
Fig. 5.
Fig. 5.
Endogenous synthesis of palmitate in various tissues throughout the day. Mice were labeled with 2H2O at 12 PM and tissues collected, and endogenous palmitate synthesis was calculated at various times after provision of daily food: 6 PM (0 h), 9 PM (3 h), 12 AM (6 h), and 12 PM (18 h) in subcutaneous (A) and epididymal (B) adipose depots and in liver (C). D: endogenously synthesized palmitate was also calculated in plasma VLDL at 6 PM, 9 PM, 12 AM, and 12 PM in the same mice. Values represent palmitate synthesis in the total subcutaneous and epididymal depots as well as in the total liver. Palmitate synthesis in VLDL is expressed per milliliter of serum. Values are means ± SE (n = 6 mice/dietary group). ***P < 0.001, **P < 0.01, *P < 0.05, difference from AL values by ANOVA and Bonferroni post hoc test. ↓Time when daily food was provided to CR mice.
Fig. 6.
Fig. 6.
Effect of calorie restriction on lipogenic gene expression in liver. FA synthase (FAS; A), acetyl-CoA carboxylase 1 (ACC1; B), sterol regulatory element-binding protein-1 (SREBP-1; C), and peroxisome proliferator-activated receptor-γ (PPARγ; D) gene expression was measured in the liver of CR and AL mice at 6 PM, 9 PM, or 12 AM. Expression was normalized first to both GAPDH and β2-microglobulin, and then these normalized values were averaged. Values are shown relative to AL values measured at 6 PM [relative units (RU)]. Values are means ± SE (n = 6 mice/dietary group). **P < 0.01, *P < 0.05, difference from time-matched AL values by ANOVA and Bonferroni post hoc test. ↓Time when daily food was provided to CR mice.
Fig. 7.
Fig. 7.
Effect of calorie restriction on lipogenic gene expression in adipose tissue. FAS (A), ACC1 (B), SREBP-1 (C), and PPARγ (D) gene expression was measured in the adipose tissue of CR and AL mice at 6 PM, 9 PM, or 12 AM. Expression was normalized first to both GAPDH and β2-microglobulin, and then these normalized values were averaged. Values are shown relative to AL values measured at 6 PM (RU). Values are means ± SE (n = 6 mice/dietary group). ***P < 0.001, difference from time-matched AL values by ANOVA and Bonferroni post hoc test. ↓Time when daily food was provided to CR mice.

References

    1. Anderson RM, Shanmuganayagam D, Weindruch R. Caloric restriction and aging: studies in mice and monkeys. Toxicol Pathol 37: 47–51, 2009 - PMC - PubMed
    1. Bassilian S, Ahmed S, Lim SK, Boros LG, Mao CS, Lee WN. Loss of regulation of lipogenesis in the Zucker diabetic rat. II. Changes in stearate and oleate synthesis. Am J Physiol Endocrinol Metab 282: E507–E513, 2002 - PubMed
    1. Berrigan D, Lavigne JA, Perkins SN, Nagy TR, Barrett JC, Hursting SD. Phenotypic effects of calorie restriction and insulin-like growth factor-1 treatment on body composition and bone mineral density of C57BL/6 mice: implications for cancer prevention. In Vivo 19: 667–674, 2005 - PubMed
    1. Brochmann EJ, Duarte ME, Zaidi HA, Murray SS. Effects of dietary restriction on total body, femoral, and vertebral bone in SENCAR, C57BL/6, and DBA/2 mice. Metabolism 52: 1265–1273, 2003 - PubMed
    1. Cao H, Gerhold K, Mayers JR, Wiest MM, Watkins SM, Hotamisligil GS. Identification of a lipokine, a lipid hormone linking adipose tissue to systemic metabolism. Cell 134: 933–944, 2008 - PMC - PubMed

Publication types

MeSH terms

LinkOut - more resources