. 2009 Nov 17;106(46):19485-90.
doi: 10.1073/pnas.0909228106. Epub 2009 Nov 3.

Hypoxia-induced pathological angiogenesis mediates tumor cell dissemination, invasion, and metastasis in a zebrafish tumor model

Affiliations

Hypoxia-induced pathological angiogenesis mediates tumor cell dissemination, invasion, and metastasis in a zebrafish tumor model

Samantha Lin Chiou Lee et al. Proc Natl Acad Sci U S A. .

Abstract

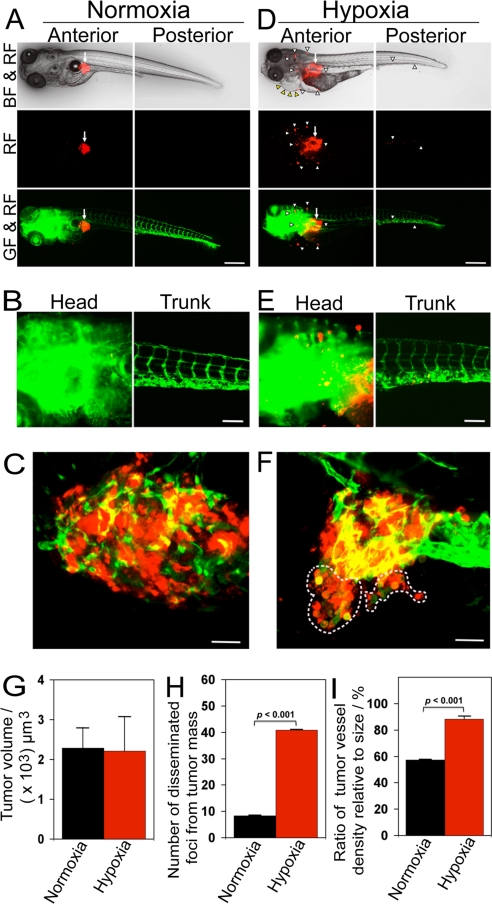
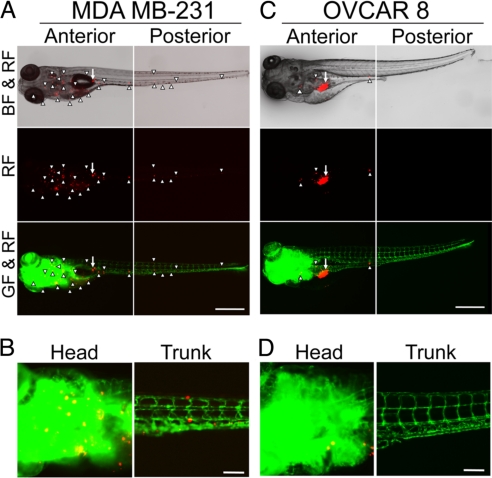
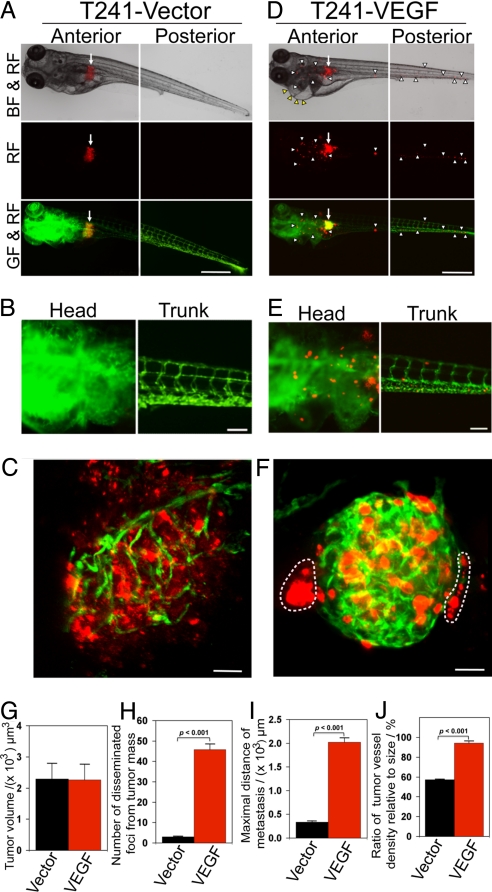
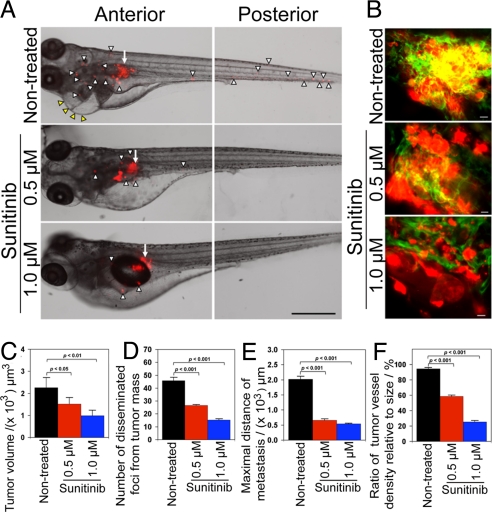
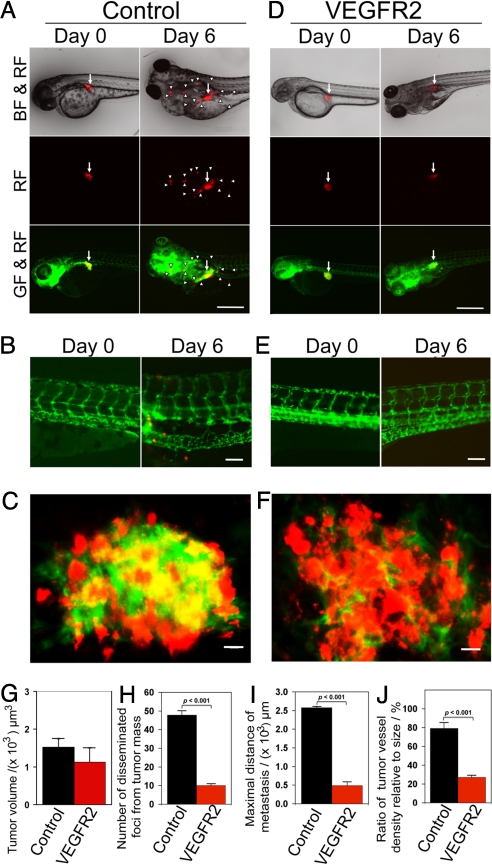
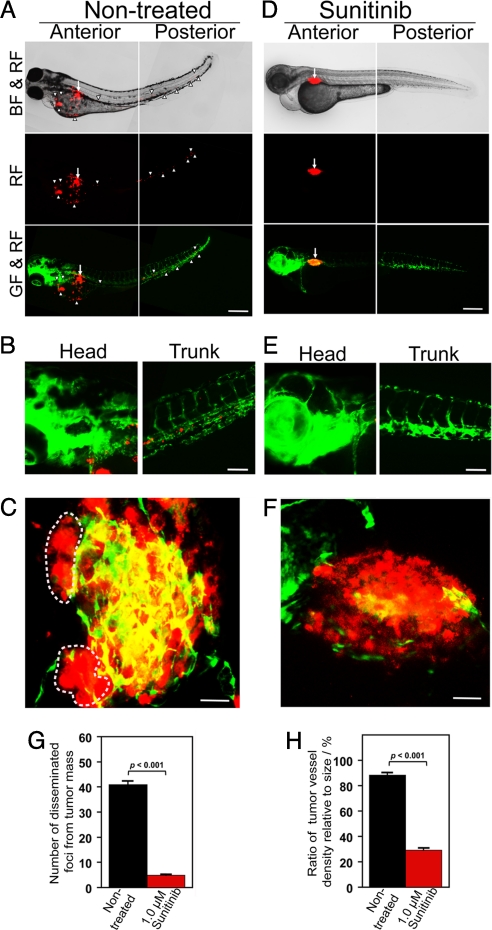
Mechanisms underlying pathological angiogenesis in relation to hypoxia in tumor invasion and metastasis remain elusive. Here, we have developed a zebrafish tumor model that allows us to study the role of pathological angiogenesis under normoxia and hypoxia in arbitrating early events of the metastatic cascade at the single cell level. Under normoxia, implantation of a murine T241 fibrosarcoma into the perivitelline cavity of developing embryos of transgenic fli1:EGFP zebrafish did not result in significant dissemination, invasion, and metastasis. In marked contrast, under hypoxia substantial tumor cells disseminated from primary sites, invaded into neighboring tissues, and metastasized to distal parts of the fish body. Similarly, expression of the hypoxia-regulated angiogenic factor, vascular endothelial growth factor (VEGF) to a high level resulted in tumor cell dissemination and metastasis, which correlated with increased tumor neovascularization. Inhibition of VEGF receptor signaling pathways by sunitinib or VEGFR2 morpholinos virtually completely ablated VEGF-induced tumor cell dissemination and metastasis. To the best of our knowledge, hypoxia- and VEGF-induced pathological angiogenesis in promoting tumor dissemination, invasion, and metastasis has not been described perviously at the single cell level. Our findings also shed light on molecular mechanisms of beneficial effects of clinically available anti-VEGF drugs for cancer therapy.


Conflict of interest statement

The authors declare no conflict of interest.

Figures

Fig. 1.
Fig. 1.
Hypoxia promotes T241 tumor cell invasion, dissemination and metastasis. (A and D) DiI-labeled T241 tumor cells were injected into the perivitelline space of 48 h post-fertilization embryos and tumor cell invasion, dissemination and metastasis were detected under normoxia and hypoxia using fluorescent microscopy at day 3 post-injection. Arrows indicate primary tumors. Yellow arrowheads indicate pericardium edema. White arrowheads indicate disseminated tumor foci. (Scale bar, 500 μm.) (B and E) High-resolution micrographs of A and D, respectively. (Scale bar, 100 μm.) (C and F) Representative 3-D micrographs of confocal images of tumors (red) and tumoral as well as peritumoral vasculatures (green). Yellow signals show the intratumoral microvessels overlapping with tumor cells. Dashed lines encircle invasive fronts of T241 tumors under hypoxia. (Scale bar, 10 μm.) (G) Quantification of tumor volume (n = 13/group). (H) Quantification of numbers of disseminated tumor foci (n = 13/group). (I) Quantification of tumor vessel density relative to tumor sizes (n = 7/group). Data are represented as mean ± SEM.
Fig. 2.
Fig. 2.
Dissemination and metastasis of human tumor cells in zebrafish embryos. (A and C) Highly metastatic human MDA MB-231 breast and low metastatic human OVCAR 8 ovarian cancer cells were implanted into 48 h post-fertilization zebrafish embryos. Tumor cell dissemination and metastasis were detected at day 6 post-injection. Arrows indicate primary tumors and arrowheads indicate disseminated tumor foci. (Scale bar, 500 μm.) (B and D) High-resolution micrographs of A and C, respectively to visualize single metastatic tumor cells in the trunk regions. (Scale bar, 100 μm.)
Fig. 3.
Fig. 3.
Invasion, dissemination and metastasis of T241-VEGF tumors. (A and D) DiI-labeled T241-vector and T241-VEGF tumor cells were implanted in the perivitelline space and tumor cell invasion and dissemination were examined at day 6 post-injection. Arrows indicate primary tumors. Yellow arrowheads indicate pericardium edema. White arrowheads indicate disseminated tumor foci. (Scale bar, 500 μm.) (B and E) High-resolution micrographs of A and D, respectively to visualize single metastatic tumor cells. (Scale bar, 100 μm.) (C and F) Representative 3-D micrographs of confocal images of tumors (red) and tumor vasculatures (green). Dashed lines encircle invasive fronts of T241-VEGF tumors. (Scale bar, 10 μm.) (G) Quantification of tumor volume (n = 14/group). (H) Quantification of numbers of disseminated tumor foci (n = 14/group). (I) Averages of maximal distances of metastatic foci (n = 14/group). (J) Quantification of tumor vessel density relative to tumor sizes (n = 7/group). Data are represented as mean ± SEM.
Fig. 4.
Fig. 4.
Inhibition of tumor cell invasion, dissemination and metastasis by sunitinib. (A) Representative zebrafish embryos treated with or without 0.5 and 1.0 μM sunitinib. Arrows indicate primary tumors and arrowheads indicate disseminated and metastatic tumor cells in the distal parts of the fish body. (Scale bar, 500 μm.) (B) Representative 3-D micrographs of confocal images of tumors (red) and tumor vasculatures (green) in sunitinib-treated and non-treated groups. (Scale bar, 10 μm.) (C) Quantification of tumor volume (n = 10/group). (D) Quantification of disseminated tumor foci (n = 10/group). (E) Averages of maximal distances of metastatic foci (n = 10/group). (F) Quantification of tumor vessel density relative to tumor sizes (n = 7/group). Data are represented as mean ± SEM.
Fig. 5.
Fig. 5.
Inhibition of tumor cell invasion, dissemination and metastasis by VEGFR2 morpholinos. (A and D) VEGFR2 specific morpholinos and control morpholinos were injected into the blastoma of 1 h post-fertilization at 1–4-cell stages. DiI-labeled T241-VEGF tumor cells were implanted in the perivitelline space of 48 h post-fertilization embryos and tumor cell invasion, dissemination and metastasis were detected at days 0 and 6 post-injection. White arrowheads indicate disseminated tumor foci. (Scale bar, 500 μm.) (B and E) High-resolution micrographs of A and D, respectively to visualize single metastatic tumor cells in the trunk regions. (Scale bar, 100 μm.) (C and F) Representative 3-D micrographs of confocal images of tumors (red) and tumor vasculatures (green). (Scale bar, 10 μm.) (G) Quantification of tumor volume (n = 12/group). (H) Quantification of numbers of disseminated tumor foci (n = 12/group). (I) Averages of maximal distances of metastatic foci (n = 12/group). (J) Quantification of tumor vessel density relative to tumor size (n = 7/group). Data are represented as mean ± SEM.
Fig. 6.
Fig. 6.
Sunitinib inhibits hypoxia-induced invasion, dissemination and metastasis of T241 tumors. (A and D) DiI-labeled T241 tumor cells were implanted in the perivitelline space of 48 h post-fertilization embryos and shortly after injection zebrafish embryos were placed into a hypoxic chamber containing 7.5% air saturation, immediately followed by treatment with 1.0 μM sunitinib. Tumor cell invasion, dissemination and metastasis were detected at day 3 post-injection. Arrows indicate primary tumors and arrowheads indicate disseminated tumor foci. (Scale bar, 500 μm.) (B and E) High-resolution micrographs of A and D, respectively to visualize single metastatic tumor cells in the trunk regions. (Scale bar, 100 μm.) (C and F) Representative 3-D micrographs of confocal images of tumors (red) and tumor vasculatures (green). Dashed lines encircle invasive fronts of T241 tumors. (Scale bar, 10 μm.) (G) Quantification of numbers of disseminated tumor foci (n = 11/group). (H) Quantification of tumor vessel density relative to tumor sizes (n = 7/group). Data are represented as mean ± SEM.

References

    1. Folkman J. Tumor angiogenesis: Therapeutic implications. N Engl J Med. 1971;285:1182–1186. - PubMed
    1. Weidner N, Semple JP, Welch WR, Folkman J. Tumor angiogenesis and metastasis–correlation in invasive breast carcinoma. N Engl J Med. 1991;324:1–8. - PubMed
    1. Cao Y. Tumor angiogenesis and molecular targets for therapy. Front Biosci. 2009;14:3962–3973. - PubMed
    1. Carmeliet P, Jain RK. Angiogenesis in cancer and other diseases. Nature. 2000;407:249–257. - PubMed
    1. Jain RK. Normalization of tumor vasculature: An emerging concept in antiangiogenic therapy. Science. 2005;307:58–62. - PubMed

Publication types

MeSH terms

Substances

LinkOut - more resources